
 Contents of the DataSource.js file
To execute the example, create an HTML page and perform the following operations:
1. Add a link to the CSS file named PP.css.
Also, add links to the following JS files: PP.js, PP.GraphicsBase.js, PP.Charts.js, dataSource.js and resources.ru.js.
The DataSource.js file determines a variable named dataSource that contains a data source for the PP.Ui.RatingChart component.
Contents of the DataSource.js file
2. Next in the <head> tag add a script that creates a rating chart:
<script type="text/javascript">
    var ratingChart; // Rating chart
    function createRatingChart() {
        // Set path to the root folder containing resource files
        PP.resourceManager.setRootResourcesFolder("../resources/");
        // Set language settings for resources
        PP.setCurrentCulture(PP.Cultures.ru);
        // Create time line
        var timeline = new PP.Ui.Timeline({
            ParentNode: "timeline", // Parent element identifier
            ImagePath: "../build/img/", // Path to the file with images
            Width: 500, // Scale width
            CurrentStep: 0, // Scale step
            Slider: { // Scale tick marks
                Ticks: ["2007", "2006", "2005", "2004", "2003", "2002", "2001", "2000",
                   "1999", "1998", "1997", "1996", "1995", "1994", "1993", "1992",
                   "1991", "1990", "1989", "1988", "1987", "1986", "1985", "None"]
            }
        });
        /* Create rating chart */
        ratingChart = new PP.Ui.RatingChart({
            AllowMultipleSelection: false, // Disable multiple selection of elements
            ParentNode: "ratingChart", // Parent element identifier
            ImagePath: "../build/img/", // Path to the image folder
            DataSource: dataSource, // Set data source
            Timeline: timeline, // Determine time line
            NumberFormat: "#,##0.00", // Data format
            TrendLine: { // Set trend line
                LineType: PP.Ui.LineTypes.ShortDashDotDot, // Line type
                LineWidth: 2, // Trend line width
                LineColor: "#AA3333", // Line color
                Value: 100 // Value corresponding to the trend line
            },
            ColumnSpacing: 0, // Distance between columns
            MinColumnWidth: 30, // Minimum column width
            SplittedTop: 2, // Number of displayed over splitter data series on the first chart rendering
            UseAnimation: true, // Enable to use animations
            ShowValueTimeout: 800, // Chart modification animation duration
            MoveItemsTimeout: 800, // Data series order change animation duration
            DelayDuration: 1500, // Animation delay duration of time line step change
            MoveActiveToEnd: true, // Enable automatic moving of the active value column to the end
            AreDataColumnsResizable: true, // Enable column width change using mouse
            Height: 250,
            Width: 500
        });
    };
</script>
3. In the <body> tag specify name of the function that creates a rating chart as value of the onLoad attribute. Within this tag place a block with the ratingChart identifier that will store the created rating chart and the timeline block that will store the timeline:
<body onload="createRatingChart()">
    <div style="border: #CCCCCC 1px solid; padding: 1px; margin: 1px; width: 512px">
        <div style="border: #CCCCCC 1px solid; margin: 5px; width: 500px " id="ratingChart">
        </div>
        <div id="timeline" style="height: 80px;"></div>
    </div>
</body>
To execute custom scenarios with the rating chart, including the examples given in pages with description of properties, methods and events of this component and its constituent elements, place the code either after the script specified above or in the browser console.
4. In the end of the document insert code that sets styles corresponding to client OS to the document.body node:
<script type="text/javascript">
    PP.initOS(document.body);
</script>
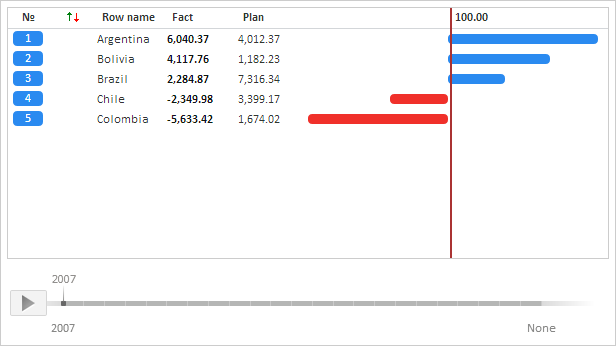
After executing the example the PP.Ui.RatingChart component is placed on the HTML page:
See also: