Before executing the example, study the recommendations for code writing.
To create a histogram with legend, use HTML code:
<!DOCTYPE html PUBLIC "-//W3C//DTD XHTML 1.0 Transitional//EN" "http://www.w3.org/TR/xhtml1/DTD/xhtml1-transitional.dtd">
<html>
<head>
    <meta http-equiv="X-UA-Compatible" content="IE=edge" />
    <meta http-equiv="Content-Type" content="text/html; charset=UTF-8">
    <title>Histogram</title>
    <script src="../build/PP.js" type="text/javascript"></script>
    <script src="../build/PP.GraphicsBase.js" type="text/javascript"></script>
    <script src="../build/PP.Charts.js" type="text/javascript"></script>
    <script src="../build/PP.Charts_Canvas.js" type="text/javascript"></script>
    <link href="../build/PP.css" rel="stylesheet" type="text/css" />
    <script src="../resources/PP.resources.ru.js" type="text/javascript"></script>

    <style type="text/css">
    div#chart {
        border: #CCCCCC 1px solid;
        padding: 1px;
        margin: 1px;
        width: 600px;
        height: 500px;
    }
    </style>

    <script type="text/javascript">
        var chart; // Chart
        // Create a chart
        function createChart() {
            // Create values arrays for data series
            var data0 = [-10, 10, -20, 20, -30];
            var data1 = [-20, 20, -30, 30, -40];
            var data2 = [-30, 30, -40, 40, -50];
            var data3 = [-40, 40, -50, 50, -60];
            var data4 = [-50, 50, -60, 60, -70];
            var trendData = [10, 20, 30, 40, 50];
            // Create a color values array
            var colors = ["rgb(192,217,253)", "rgb(163,200,252)", "rgb(134,183,251)",
            "rgb(96,161,250)", "rgb(192,142,204)", "rgb(192,107,188)"
            ];
            // Chart
            chart = new PP.Ui.Chart({
                Width: 600, // Chart width
                Height: 500, // Chart height
                // Chart paddings
                PaddingLeft: 15,
                PaddingRight: 20,
                PaddingTop: 30,
                PaddingBottom: 40,
                UseSoftPadding: false, // Indicates whether alternative paddings calculation is used
                ParentNode: "chart", // Parent element
                Type: "Column", // Chart type
                ToolTip:{},
                AlternateColumnPadding: true,
                PointPadding: -0.2,
                ExcludeInvisibleSeries: true, // Indicates whether invisible series must be excluded from calculation
                // Data series
                "Series": [{ // Series 1
                    "Name": "Australia", // Series name
                    "Data": data0, // Values array
                    "Color": colors[0], // Color
                    "LineColor": colors[1], // Line color
                    "LineWidth": 4, // Line width
                    "ShowInLegend": false, // Indicates whether a series is displayed in legend
                    "IsVisible": true // Indicates whether a series is visible
                }, { // Series 2
                    "Name": "Asia",
                    "Data": data1,
                    "Color": colors[1],
                    "LineColor": colors[2],
                    "LineWidth": 4,
                    "ShowInLegend": true
                }, { // Series 3
                    "Name": "Africa",
                    "Data": data2,
                    "Color": colors[2],
                    "LineColor": colors[3],
                    "LineWidth": 4,
                    "ShowInLegend": true
                }, { // Series 4
                    "Name": "Europe",
                    "Data": data3,
                    "Color": colors[3],
                    "LineColor": colors[4],
                    "LineWidth": 4,
                    "ShowInLegend": true
                }, { // Series 5
                    "Name": "North America",
                    "Data": data4,
                    "Color": colors[4],
                    "LineColor": colors[5],
                    "LineWidth": 4,
                    "ShowInLegend": true
                }, {
                    // Trend line
                    "Type": "Line", // Series type
                    "Name": "Trend",
                    "Data": trendData,
                    "Color": colors[4],
                    "LineColor": colors[5],
                    "LineWidth": 2,
                    "ShowInLegend": false,
                    "Trend": true
                }],
                // Category axis
                "XAxis": {
                    "Categories": ["2001", "2002", "2003", "2004", "2005"], // Categories arrays
                    // Label settings
                    "Labels": {
                        "Enabled": true
                    }
                },
                // Value axis
                "YAxis": {
                    "Labels": {
                        "Enabled": true
                    }, // Label settings
                    "Max": 110, // Maximum value
                    "Min": -110, // Minimum value
                },
                // Secondary value axis
                "YSAxis": {
                    "Enabled": false // Indicates whether axis is active
                },
                // Chart render area
                "PlotArea": {},
                // Chart legend
                "Legend": {
                    CellSpacing: 60 // Legend element spacings
                },
                // Chart title
                "Title": {
                    "Text": "Chart"
                }
            })
        }
    </script>
</head>
<body onload="createChart()">
    <div id="chart"></div>
</body>
</html>
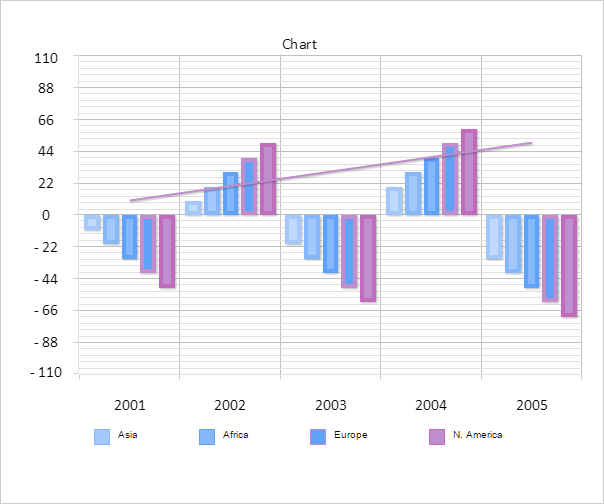
After executing the example, the Chart component will be placed on html page as histogram with legend:

See also: