Alignment: PP.Ui.BubbleTreeAlignment
The Alignment property determines bubble tree orientation.
Use JSON or the setAlignment method to set the property value, and the getAlignment method to get the property value.
To execute the example, the page must contain the BubbleTree component named bubbleTree (see Example of Creating the BubbleTree Component). Set minimum size of chart bubble and chart orientation, next refresh the chart. Get coordinates of chart center, color value, set for no data bubbles, size of free area in the chart, legend position, size scale type, name of component settings property. Determine if the point with specified coordinates is outside component borders:
// Set minimum size for chart bubble
bubbleTree.setBubbleMinSize(20);
// Set chart orientation
bubbleTree.setAlignment(PP.Ui.BubbleTreeAlignment.Right);
// Refresh the chart
bubbleTree.refresh();
// Get chart orientation values
var align = bubbleTree.getAlign();
console.log("Chart orientation values: X:" + align.X + " Y:" + align.Y);
// Get coordinates of the chart center
var center = bubbleTree.getCenter();
console.log("Coordinates of chart center: X:" + center.X + " Y:" + center.Y);
// Get settings for color panel in wizard settings format
var colorOptions = bubbleTree.getColorOptions();
// Show value of the color set when no data is available
var ndc = colorOptions[8].Value;
console.log("Color set when no data is available: R:" + ndc.getR() + " G:" + ndc.getG() + " B:" + ndc.getB());
// Get chart free area that houses different items
var freeArea = bubbleTree.getFreeArea();
console.log("Sizes of chart free area: " + freeArea.getWidth() + "x" + freeArea.getHeight())
// Get settings for legend panel in wizard settings format
var legendOptions = bubbleTree.getLegendOptions();
// Show legend position
console.log("Legend position: " + legendOptions[0].Value);
// Get settings for size panel in wizard settings format
var sizeOptions = bubbleTree.getSizeOptions();
// Show size scale type
console.log("Size scale type: " + sizeOptions[0].Value)
// Get component settings in wizard settings format
var state = bubbleTree.getState();
// Show name of component settings property
console.log("Name of component settings property: " + state.getPropertyName());
// Determine if the point with specified coordinates is outside of component borders
var point = {
    X: 50,
    Y: 100
};
var res1 = "The point (" + point.X + "," + point.Y + ") is within the component borders"
var res2 = "The point (" + point.X + "," + point.Y + ") is outside of component borders"
console.log(bubbleTree.isPointOut(point.X, point.Y) ? res2 : res1)
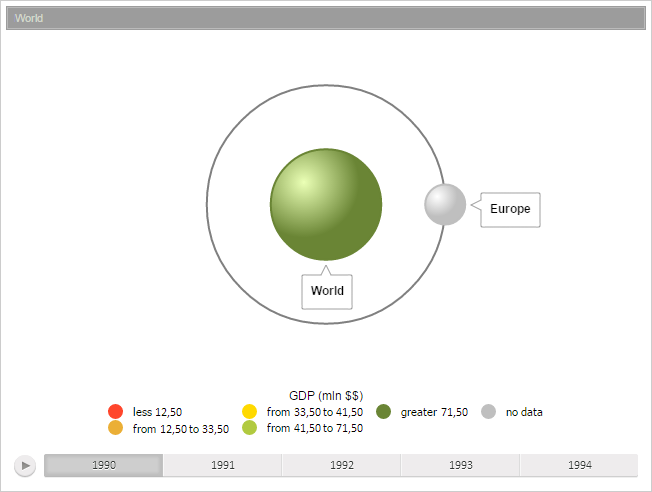
After the example execution new orientation is set for the chart, and minimum size of chart bubbles is changed:
Also the browser console shows coordinates of chart center, color value, set for bubbles containing no data, size of chart free area, legend position, size scale type, name of component settings property, and the result of determining point position:
Chart orientation values: X:1 Y:0
Coordinates of chart center: X:320 Y:174.5
Color set when no data is available: R:191 G:191 B:191
Sizes of chart free area: 640x349
Legend position: Bottom&Center
Size scale type: Linear
Name of component settings property: TreeChartSettings
The point (50,100) is within the component borders
See also: