HoverMode: PP.HoverMode;
The HoverMode property determines method of tooltip displaying.
Use JSON or the setHoverMode method to set the property value and the getHoverMode method to get the property value.
To execute this example, the HTML page must contain the BubbleChart component named bubbleChart (see Example of Creating the BubbleChart Component). Determine new tooltip object and set a tooltip for data series with the index 0:
// Determine tooltip
var tooltip = new PP.Ui.ChartTooltip({
    HasMask: true, // Create tooltip text by template
    MaskText: "{%Name}. X: {%XValue:#,##.00}, Y: {%YValue:#,##.00}", // Tooltip template
    HoverMode: PP.HoverMode.MouseOver, // Tooltip is activated on the mouse hovering
});
// Set tooltip for the data series with the 0 index
var serie = bubbleChart.getSeries()[0];
serie.setTooltip(tooltip);
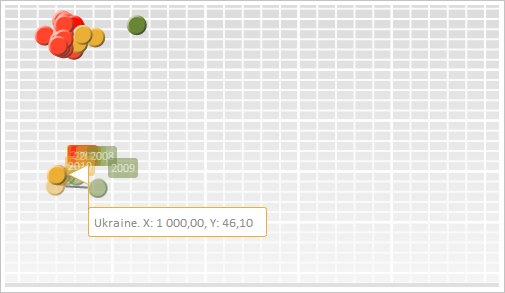
Hover the cursor over the bubble shown in the screenshot below. A tooltip with specified parameters is shown as the result:
Display the tooltip and set new position for it:
// Display tooltip
tooltip.show();
// Set new position for tooltip
tooltip.setPosition(tooltip.getTargetX() + 10, tooltip.getTargetY() + 10);
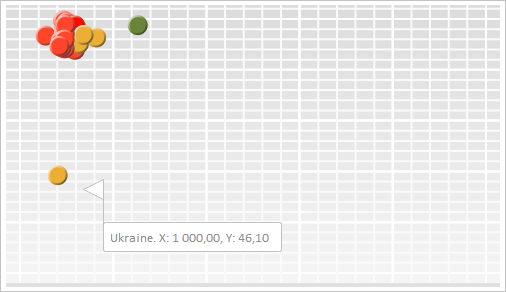
As the result tooltip position is changed:
See also: