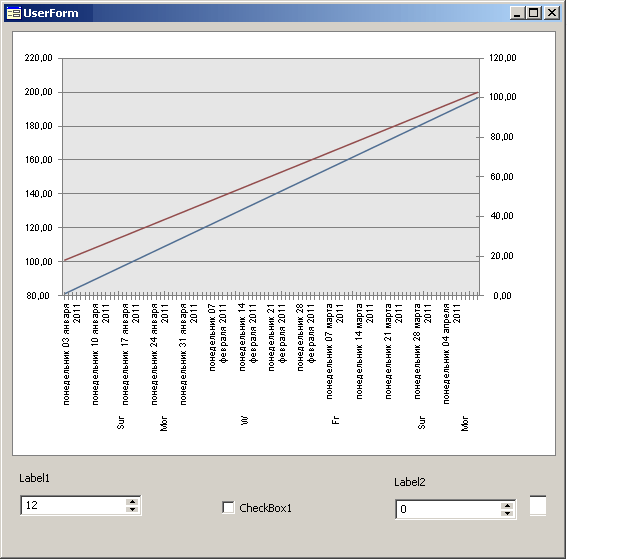
Below is the example of displaying scale labels by categories. To execute the example, create an assembly with the UserForm form and a unit with the code of the CChartPointNameNode custom class. The CChartPointNameNode class is described on the CChartPointNameNode User Class Description page. Add links to the Chart, Collections, Forms and ExtCtrls system assemblies. Place the following components of the form: Label1, Label2, CheckBox1, ChartBox1, IntegerEdit1, IntegerEdit2, and UiChart1. The UiChart1 component is a data source for the ChartBox1 component.
Class UserForm: Form
Label1: Label;
Label2: Label;
CheckBox1: CheckBox;
ChartBox1: ChartBox;
UiChart1: UiChart;
IntegerEdit1: IntegerEdit;
IntegerEdit2: IntegerEdit;
Root, MonthLevel, DayLevel: CChartPointNameNode;
m_RootPointsCount: Integer = 0;
MaxPointCount: Integer = 3000;
CurDay: DateTime;
//Add a procedure, using which each hierarchy level is assigned a value:
Sub SetRootPointsCount(Value: Integer);
Var
d: DateTime;
i: Integer;
Begin
Root.Clear;
MonthLevel.Clear;
DayLevel.Clear;
For i:=0 To Value-1 Do
d := DateTime.AddDays(CurDay, i);
DayLevel.AddValue(i, "Day Day Day Day " + d.ToString);
If d.Day = 1 Then
MonthLevel.AddValue(i,d);
If d.Month = 1 Then
Root.AddValue(i,d);
End If;
End If;
End For;
End Sub SetRootPointsCount;
//Plot a chart:
Sub UiChart1OnGetDataValue(Sender: Object; Args: IUiChartGetDataValueEventArgs);
Begin
Args.Value := Args.PointIndex + Args.SerieIndex * UiChart1.PointCount + 1;
Args.Result := True;
End Sub UiChart1OnGetDataValue;
//Create a form:
Sub OBJ773FormOnCreate(Sender: Object; Args: IEventArgs);
Begin
CurDay := DateTime.ComposeDay(DateTime.Now.Date.Year, 1, 1);
Root := New CChartPointNameNode.Create(Null); // YearLevel
Root.Format := "dd MMMM yyyy";
Root.Name := "Years";
MonthLevel := New CChartPointNameNode.Create(Root);
MonthLevel.Format := Root.Format;
MonthLevel.Name := "Months";
DayLevel := New CChartPointNameNode.Create(MonthLevel);
DayLevel.Format := Root.Format;
DayLevel.Name := "Days";
SetRootPointsCount(MaxPointCount);
IntegerEdit1.MaxValue := UiChart1.PointCount * UiChart1.SerieCount;
IntegerEdit2.MaxValue := MaxPointCount;
IntegerEdit2.Value := UiChart1.PointCount;
UiChart1.Chart.Series.Item(0).AtSecondaryAxis := True;
UiChart1.Chart.AxisX.TextAngle := 90;
End Sub OBJ773FormOnCreate;
//Add an event that allows the integer value editor to display the number of points of the//chart:
Sub IntegerEdit1OnChange(Sender: Object; Args: IEventArgs);
Begin
UiChart1.PointCount := IntegerEdit1.Value;
End Sub IntegerEdit1OnChange;
//Add an event that allows the integer value editor display the number of //categories between the tick mark labels:
Sub IntegerEdit2OnChange(Sender: Object; Args: IEventArgs);
Begin
UiChart1.Chart.TickLabelSpacing := IntegerEdit2.Value;
End Sub IntegerEdit2OnChange;
//Add an event that enables the user to determine names of graph points:
Sub UiChart1OnGetPointName(Sender: Object; Args: IUiChartPointNameEventArgs);
Begin
Args.Result := "Point Point Point Point Point Point Point N " + Args.PointIndex.ToString;
End Sub UiChart1OnGetPointName;
//Add an event that enables the user to determine a name format for category axis points:
Sub UiChart1OnGetCategoryFormat(Sender: Object; Args: IUiChartCategoryFormatEventArgs);
Begin
Args.Result := "dddd dd MMMM yyyy";
End Sub UiChart1OnGetCategoryFormat;
//Add an event that enables the user to determine a root element for hierarchy of
//category axis. In the handler specify that if the checkbox is selected, the root element of the hierarchy is the year value:
Sub UiChart1OnGetPointNameRoot(Sender: Object; Args: IUiChartPointNameRootEventArgs);
Begin
If CheckBox1.Checked Then
Args.Result := Root As IChartPointNameNode;
End If;
If Not CheckBox1.Checked Then
Args.Result := NULL;
End If;
End Sub UiChart1OnGetPointNameRoot;
//Add an event that enables the user to determine a name for category axis points:
Sub UiChart1OnGetCategoryName(Sender: Object; Args: IUiChartCategoryNameEventArgs);
Begin
Args.Result := DateTime.AddDays(CurDay, Args.PointIndex);
End Sub UiChart1OnGetCategoryName;
End Class OBJ773Form;
After executing the example a form is created that contains a chart, the PointCounts integer value editor that determines the number of category axis points, the TickLabelSpacing value editor that determines the number of categories between tick mark labels, and the checkbox for determining a root element of the hierarchy. Category scale labels are displayed according to the specified display format of hierarchy levels:

See also: