Showing of total values in rows or in columns based on source data can be set up for a data area.
Totals for rows and columns are similar, but they are set up on separate pages.
NOTE. Totals by levels and dimensions are set up similarly to the totals by rows and columns.
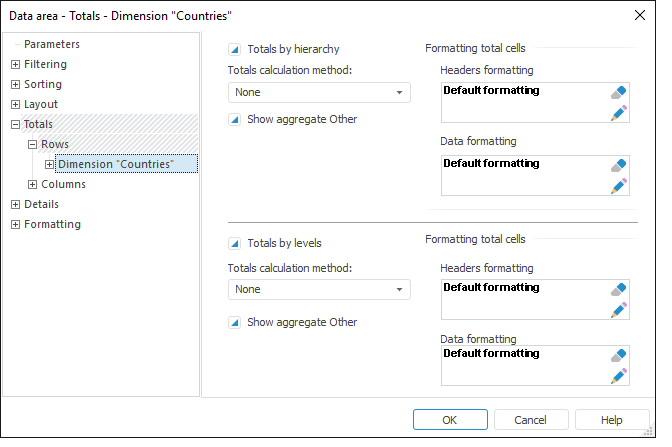
To set up total values for rows or columns, go to the Totals tab of the Data Area Properties dialog box. The dialog box looks as follows:

Use the tab to determine parameters for totals in the two areas:
The following parameters of total values calculation can be set up for each area:
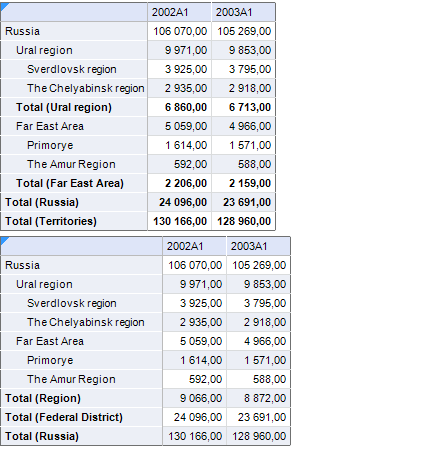
See an example of data area with the totals based on hierarchy (top data area) and based on level (bottom data area):

See also:
Getting Started with the Reports Tool in the Web Application | Data Area Properties