Speedometers display any information on a panel that looks like a speedometer.
To add a speedometer to the report sheet:
Determine the cell range to house the speedometer.
Select the Illustrations > Speedometer item in the Illustrations group of the Insert ribbon tab.
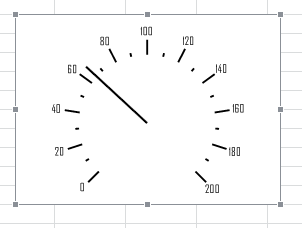
After executing these operations the Speedometer object is added into the specified cell range:
Speedometer settings can be determined only using the Fore language.
See also:
Getting Started with the Reports Tool in the Web Application | Inserting Graphics, Shapes and Text Blocks | Building Report | Working with Ready Report