When developing application code, the user may encounter memory leaks caused by potential errors or inefficiently written code. The most of memory leaks are related with the use of global variables, the Variant data type to store COM objects and custom class instances in arrays or collections.
The development environment of Foresight Analytics Platform has additional tools to detect the code fragments that cause memory leaks.
NOTE. The registry flags and code described below should be used only on creating and debugging applications. They should not be applied in commercial use.
When debugging applications in the development environment it is recommended to clear Fore runtime from time to time. This ensures that the latest code version is run and executed.
To force clear the Fore runtime from the development environment, select the Debug > Clear Fore Runtime main menu item. After the operation is confirmed, unused object are force deleted from the memory and repository cache, unused assemblies are unloaded, and possible memory leaks are detected. This operation may result in incorrect work of running and not closed objects. It is recommended to close all used object before operation execution. If after clearing the memory has locked objects, the information about them is displayed in the development environment console.
The tool allows for saving the graph with objects maintained in the development environment memory. Consider several options of saving graph.
Capabilities of the development environment can be enhanced due to the use of special registry parameters, which are described in the Advanced Logging and Getting Additional Debug Output subsection.
To track memory leaks, create the following in the registry key [HKEY_CURRENT_USER\Software\Foresight\Foresight Analytics Platform\10.0\Fore] before logging out of the repository:
The CheckLeaks parameter of the REG_DWORD type and set it to 1.
The LeaksGraphFile parameter and set in it the path and name of the file, to which the object graph will be saved.
If there are locked objects in the memory after exiting the repository, the object graph will be saved to the specified file.
The IForeRuntime.ForeObjectsGraph.SaveToFile method can be used to save the list of object in the memory to file. The objects displayed in this way are not considered as memory leaks, and the list of objects currently maintained in the memory is displayed without application code execution. The example:
Sub UserProc;
Var
Mb: IMetabase;
Runtime: IForeRuntime;
// ...
Begin
Mb := MetabaseClass.Active;
// ...
// Executable application code
// ...
Runtime := (Mb As IForeServices).GetRuntime;
Runtime.ForeObjectsGraph.SaveToFile("D:\CurrentObjects.tgf");
// ...
// Application code continuation
// ...
End Sub UserProc;
The list of objects is saved as TGF (trivial graph format). Working with file may require any editor that supports viewing and editing files in this format.
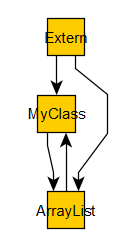
The graph example:
The link between MyClass and ArrayList means that the object of the MyClass type contains the non-empty field of the ArrayList type. If an object is a collection in the For Each cycle, the link between the collection and all its elements is also displayed. The example displays this link as the link between the ArrayList object and the MyClass object. The Extern node means an external link. If there is a link from Extern to the object, it means that there is an external link to this object.
The tool allows for saving unit/form identifier and number of the row where the object external links counter has been changed. The code should be run for execution without debugging. There are several options for tracking changes of external links counter, consider each of them.
In the registry key [HKEY_CURRENT_USER\Software\Foresight\Foresight Analytics Platform\10.0\Fore] create the ExternRefLogging REG_DWORD parameter with the 1 value. Changes of external links counter are logged on each startup of the development environment. In the ExtRefChangesFile parameters specify path and name of the file, to which the log is to be saved. If logging is kept on closing the repository, the log is automatically saved to the specified file.
The IForeRuntime.ExternReferenceLogger.Enable method can be used to enable logging of changes of external links counter. The log is saved to file by means of the IForeRuntime.ExternReferenceLogger.SaveToFile method. The log can be saved after logging is disabled. The example:
Sub UserProc;
Var
Mb: IMetabase;
ExtLogger: IExternReferenceLogger;
//...
Begin
Mb := MetabaseClass.Active;
ExtLogger := (Mb As IForeServices).GetRuntime.ExternReferenceLogger;
ExtLogger.Collapse := True;
ExtLogger.Enable := True;
ExtLogger.ObjectIndexing := True;
//...
// Executable application code
//...
ExtLogger.Enable := False;
ExtLogger.SaveToFile("D:\ExtLog.txt");
//...
// Application code continuation
//...
End Sub UserProc;
The output log looks approximately as follows:
MyClass Extern : 1
OBJ646 : 10 inc
OBJ646 : 10 inc
System : 4 dec
OBJ646 : 12 inc
OBJ646 : 12 inc
OBJ646 : 12 inc com
OBJ646 : 12 dec
OBJ646 : 14 inc
OBJ646 : 15 dec
In Garbage Collector : dec
ArrayList Extern : 1
OBJ646 : 11 inc
OBJ646 : 11 inc
System : 4 dec
OBJ646 : 13 inc
OBJ646 : 13 inc com
OBJ646 : 15 dec
Log syntax in the extended notation of extended Backus-Naur form looks as follows:
Log = { LogRecord }
LogRecord = ClassName EXTERN ":" ExtRefCount { CodePosition ChangeType [ com ] }
ChangeType = "inc" | "dec"
CodePosition = (ModuleName ":" LineNumber | "In Garbage Collector" )
ClassName, ModuleName - identifiers describing object class and the unit where external link is changed.
ExtRefCount, LineNumber - integer numbers describing object external links counter and the code string where external link is changed.
ChangeType - type of change of external link: inc - increase; dec - decrease.
com - designation used for marking links counter when working with custom class object.
When an assembly is being executed, the language interpreter loads the assembly to memory and holds it there while:
There are links to the assembly from other assemblies.
There are undestroyed class objects determined in this assembly.
There are undestroyed objects that are used to work with assembly structures (IForeAssembly, IForeClass, IForeSub and others).
Other objects referring to the loaded assembly will use the specific version of the assembly that is currently loaded to memory. Changing the code of such an assembly and its recompilation will not update the assembly in memory until finishing the work of the entire instance of Foresight Analytics Platform.
To avoid such a situation, use the debug mode during development and also add a code for destroying objects according to application logic (Dispose), for zeroing links to objects, for releasing static (Shared) class fields and variables used on module level. It is also recommended to use the Debug > Clear Fore Runtime item in the development environment main menu, which results in the running the full garbage collecting and also clears contents of static fields and variables in units. If any undestroyed objects are kept in the memory after an application is closed, the Objects in Memory dialog box opens.
Below are several examples of the code, executing of which causes memory leaks. Avoid such situations in your code.
Class MyClass: Object
Public v: Variant;
End Class MyClass;
Sub UserProc;
Var
o: MyClass;
ar: IArrayList;
Begin
o := New MyClass.Create;
ar := New ArrayList.Create;
ar.Add(o);
o.v := ar;
End Sub UserProc;
This example displays adding a class instance to array and the array is specified as class field. The garbage collector cannot correctly handle this situation, which causes objects kept in the memory.
Public Sub UserProc;
Var
o1, o2, o3: MyClass;
Begin
o1 := New MyClass.Create;
o2 := New MyClass.Create;
o3 := New MyClass.Create;
o1.v := o2;
o2.v := o3;
o3.v := o1;
End Sub UserProc;
This example displays cyclic dependency of objects. In this case memory leaks do not occur.
Public Sub UserProc;
Var
o1, o2, o3: MyClass;
ar: Array[1];
Begin
o1 := New MyClass.Create;
o2 := New MyClass.Create;
o3 := New MyClass.Create;
ar[0] := o2;
o1.v := ar[0];
o2.v := o3;
o3.v := o1;
End Sub UserProc;
This example displays the memory leak because of including an additional object as an array to the chain.
See also: