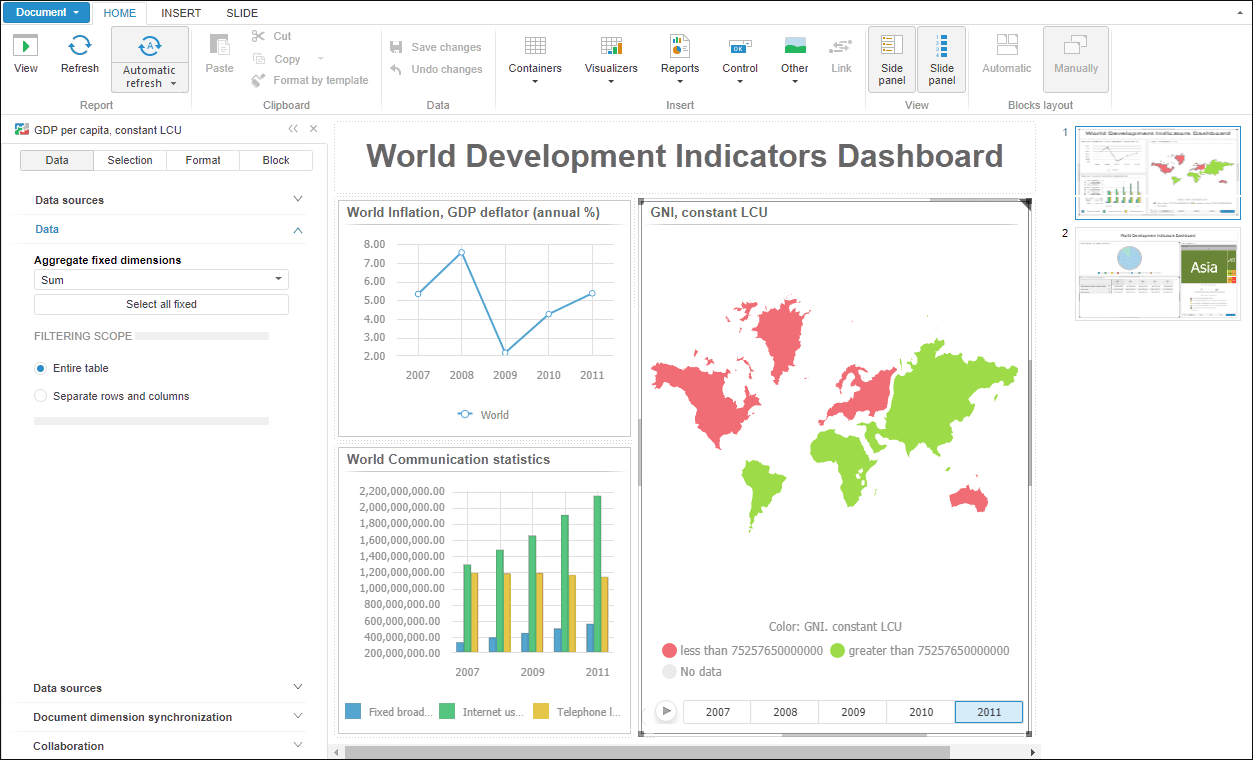
 Set up slide formatting
Tool interfaces in the web application and in the desktop application are identical, and differences in functionality are given in appropriate comments.
A slide is a single dashboard page that contains various blocks and visualizes particular information. Consequent viewing of slides enables the user to provide a full description of an object.
Using slides enables the user to create a multisheet dashboard.
NOTE. Working with slides is available if a dashboard is created in the web application. If a dashboard with slides is opened in the desktop application, only the first slide contents is available.
Make sure that the slide panel is displayed.
Select the item:
Add Slide in the slide panel's context menu.
Slides > Add Slide in the working area context menu.
Add slide in the Actions group on the Slide ribbon tab.
A slide will be added to the end of dashboard. Slide formatting settings will be applied from the previous slide.
Creating a sketch of the slide, inserting and setting up visualizers, reports, interactive controls, plugins and other blocks to the slide is executed similarly to the operations with a dashboard.
TIP. To add a slide to the specific location, select the Add Slide item in the slide's context menu, after which add the slide.
Example of a dashboard with slides:

See also: