Select the
 Indicator item in the drop-down menu of the
  Plugins button on the Home or Insert ribbon tab.
Select the New Block > Plugins < Indicator item in the dashboard's context menu.
Tool interfaces in the web application and in the desktop application are identical, and differences in functionality are given in appropriate comments.
The Indicator plugin is used to display data as single key indicators.
NOTE. The plugin is available only in the web application.
To insert the plugin:
Execute one of the operations:
Select the Indicator item in the drop-down menu of the ![]() Plugins button on the Home or Insert ribbon tab.
Plugins button on the Home or Insert ribbon tab.
Select the New Block > Plugins < Indicator item in the dashboard's context menu.
Select data source on the Report side panel tab. The tab displays all data sources in the repository available for the plugin. Select the corresponding element in the tree of objects to select or change the data source.
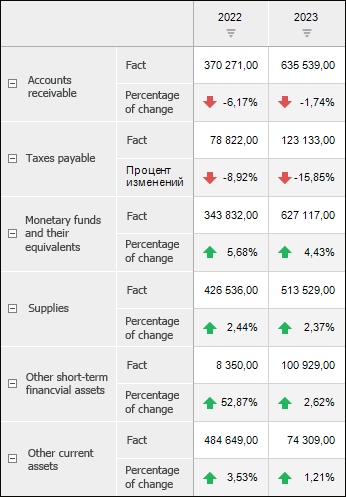
An express report is used as a data source. When creating an express report take into account the following:
Place dimensions with the indicator and the fact in rows.
Place calendar dimension in columns.
Set up conditional formatting to display changes dynamics.
Use only one fact.
The example of express report with plugin data:
After executing the operations the plugin is inserted to the dashboard as a single object.
The example of a dashboard with the Indicator plugin:
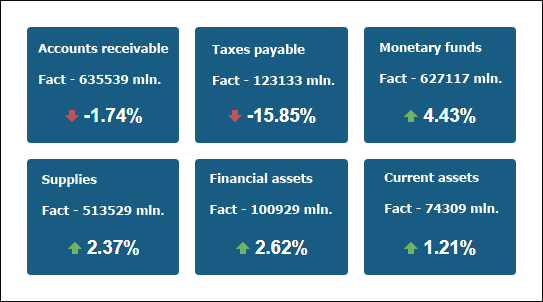
The number of displayed indicators is limited by default. Eight indicators or less are displayed by default.
To manage calendar dimension selection in the plugin:
Select the indicator.
Insert the Drop-Down List control with a calendar dimension.
Deselect the Multiple selection checkbox on the side panel in control settings.
After executing the operations, indicator data changes depending on the calendar dimension selection set in the drop-down list.
All operations with objects described in the Building Dashboard section are available for indicator.
To set up formatting of the Indicator plugin, use the Format side panel tab. To display the tab:
Make sure that the side panel is displayed.
Select the Indicator plugin in the working area.
Go to the Format tab.
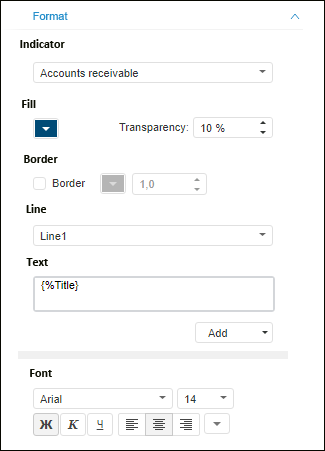
Set the parameters:
Indicator. Select the dimension element used as an indicator in the drop-down list. The indicator contains three lines: title, first value, second value. For example, plan-fact values. The settings displayed below are determined for each dimension element.
Fill. Select plugin background color in the drop-down color palette. Specify background color transparency degree in the corresponding parameter (in percents): 100% - color is opaque, 0% - color is invisible. Blue background color is used by default.
Border. Select the checkbox to display plugin border. Select border color in the drop-down color palette and set line width in pixels.
Line. Select line in the drop-down list. Determine the settings specified for each line.
Text. Enter line custom text or use templates in the Add drop-down list. Corresponding text template is set for each line.
Font. Select one of the operating system fonts in the drop-down list and set additional parameters:
Font Size. Set the required font size. The size is set in points, and it can be selected in the drop-down list or entered manually. The range of available values: [1, 72].
Font Style. Click the buttons that determine the font style:
B. Bold.
I. Italic.
U. Underline.
When the button is pressed, the corresponding font style is used. Several styles can be used simultaneously, for example, pressed B and I buttons result in bold italic font style.
Font Color. Select font color in the drop-down color palette.
See also:
Inserting and Setting Up Plugins