applyColorScheme(palette: Array);
palette. Array of color scale values.
The applyColorScheme method applies bubble chart color scale.
Array items are instances of the PP.Color class or strings that contain color value in one of the following formats:
"red";
"#000";
"RGB(123, 12, 1)".
To execute this example, the HTML page must contain the BubbleChart component named bubbleChart (see Example of Creating the BubbleChart Component).
Create and set color scale for the bubble chart, set style of history bubbles and connecting lines, and also set a handler for the bubble hovering event:
// Create an array with values of bubble chart color scale
var palette = ["#E9D8ED", "#A3C8FC", "#86B7FB", "#60A1FA", "#933DA8"];
// Set bubble chart color scale
bubbleChart.setPalette(palette);
// Apply bubble chart color scale
bubbleChart.applyColorScheme(bubbleChart.getPalette());
// Set style of values history bubbles
bubbleChart.setHistoryBubbleStyle(PP.Ui.VisualizerItemStyle.RadialGradient);
// Determines whether the same color is applied to connecting lines that is used for bubbles
bubbleChart.setUseBubbleColorForHistoryLines(true);
// Add the ItemHovered event handler
bubbleChart.ItemHovered.add(
    function() {
        console.log("The ItemHovered Event");
        // Rerender bubble chart bubbles
        bubbleChart.requestRenderFrame(true, false);
    }
);
// Refresh bubble chart
bubbleChart.refresh();
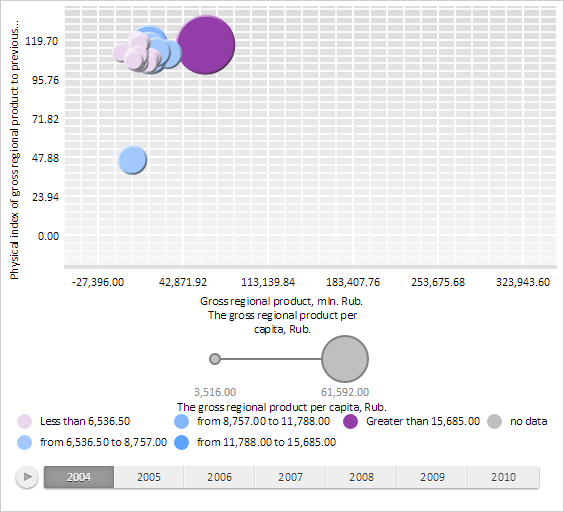
As a result, a new color scale is set for bubble chart:

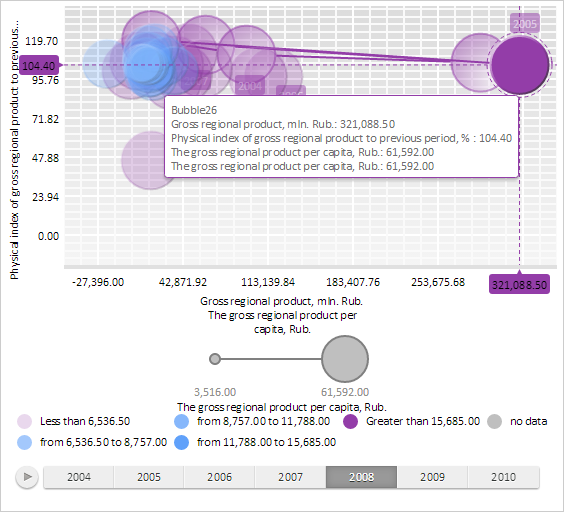
Next select 2008 in the time line and hover over a bubble. As the result, history bubbles, joined with connecting lines are shown for the selected bubble, colors of history bubbles are applied to connecting lines. 3D style with radial gradient is set for history bubbles:

The browser console also displays a message informing that one of the bubbles is hovered on:
ItemHovered event
See also: