Desktop and Web Applications
In this article:
Data Connection and Preparation
Data Analysis and Building Reports
Managing Business Processes and Tasks
Visual Designing of Business Applications
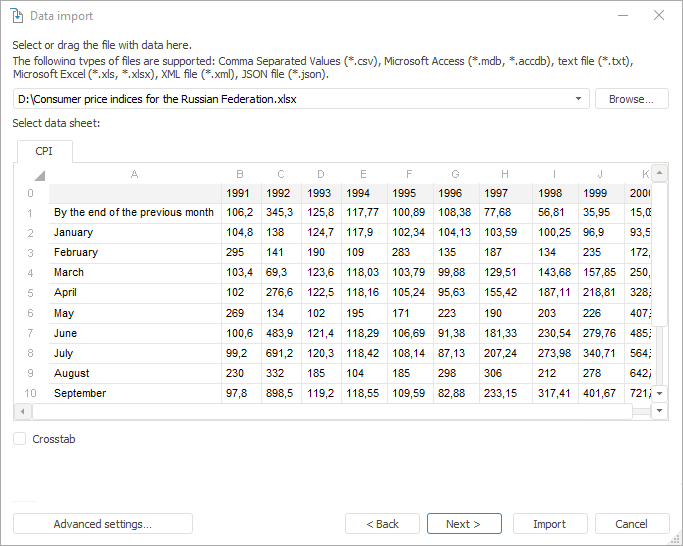
The Data Import tool is used to load data from a custom data source into a standard cube or time series database.
Key features:
Transforming and filtering data before their loading.
Support of a number of data sources: OLE DB; Microsoft Access databases; REST data sources; CSV, TXT, XLS, XLSX, XML, JSON files; Foresight Analytics Platform repository objects.
Automatic creation of all objects required for import.
Loading data to existing objects.
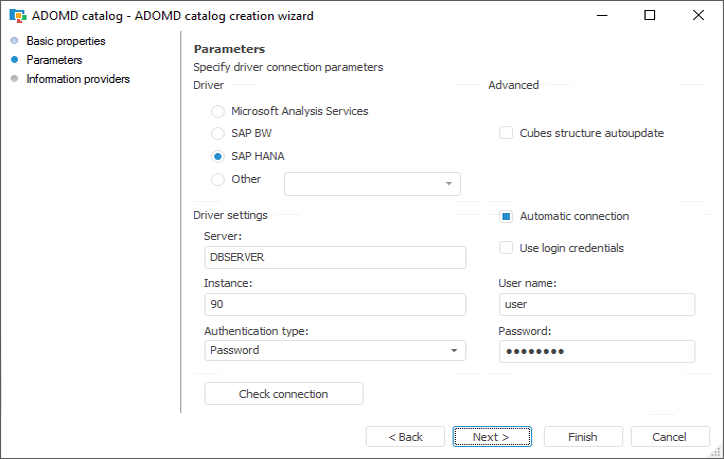
The data connection and preparation tools provide a possibility to get access to data stored in external sources.
Key features:
Connecting to relational databases.
Connecting to multidimensional databases built on Microsoft Analysis Services, SAP NetWeaver BW and other platforms.
Connecting to other platform repositories.
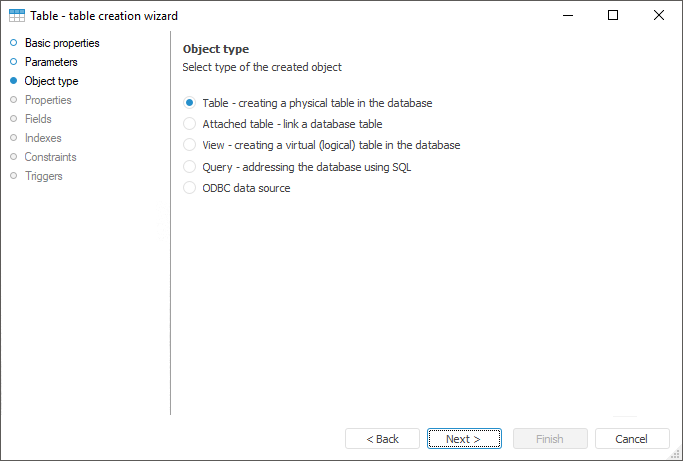
Data connection and preparation tools enable the user to create data structures and create base elements for multidimensional data sources.
Key features:
Creating table data sets.
Creating dictionaries.
Creating multidimensional data structures.
Creating DBMS commands, procedures, MDM repositories and other objects.
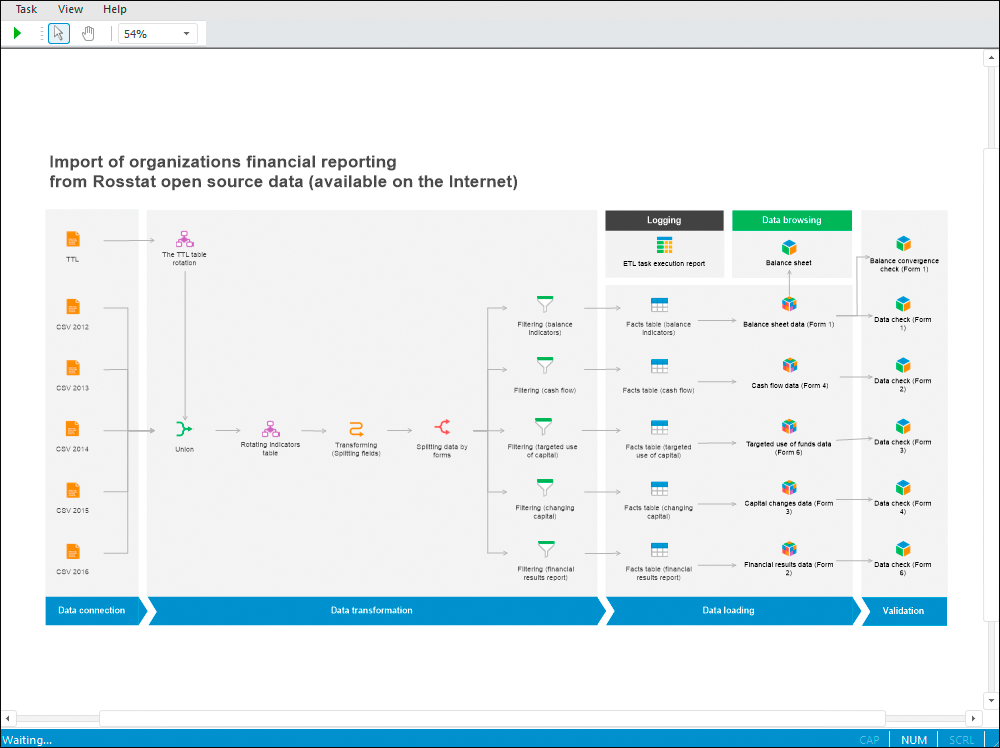
The ETL Task tool is aimed to extract data from external sources, transform and load to data consumers.
Key features:
Visual building a data transformation schema on a uniform workspace.
Merging, splitting, deduplication, grouping, filtering, sorting data before loading.
Setting up order of operations.
Logging data loading.
Support of a number of data sources: OLE DB; Microsoft Access databases, Visual FoxPro, DBase; Microsoft Excel, XML, HTML, TXT, CSV, JSON files.
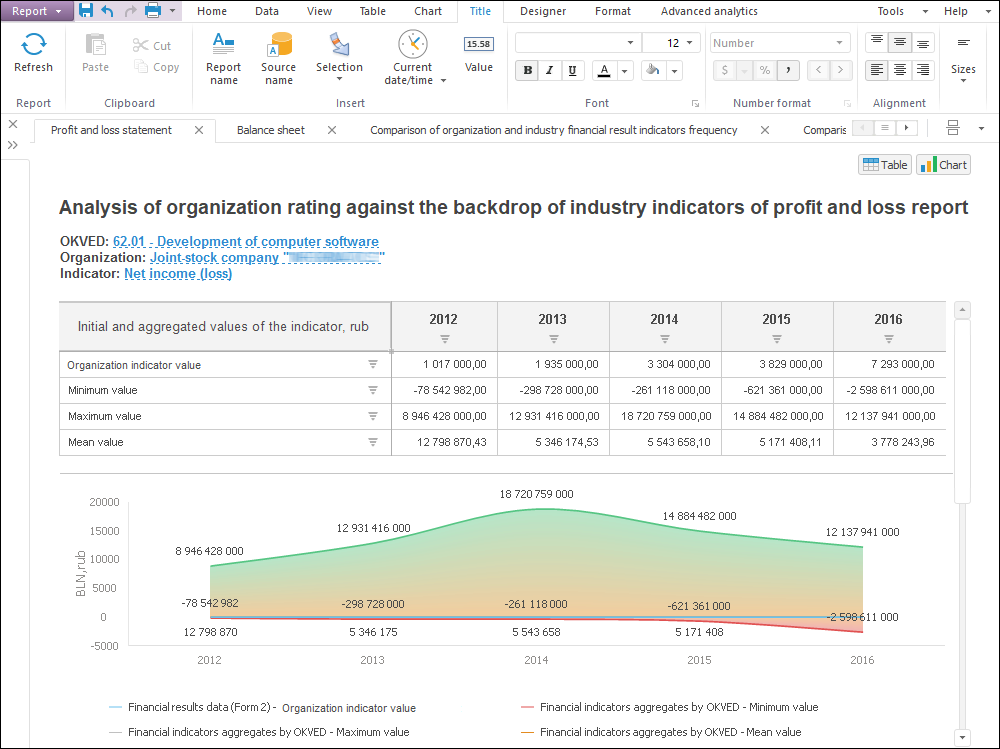
The Analytical Queries (OLAP) tool is used to quickly view and analyze data "on the fly" and display data by means of business logic.
Key features:
Building ad-hoc requests to data and express analysis by means of various analytical functions.
Setting up filtering, sorting, calculating, 80/20 analysis, building trends, conditional formatting, and so on.
Simultaneous analysis of multiple data sources in one visualizer.
Data drill down and drill up.
Checking data for correspondence with specified conditions and constraints.
Presenting data as interactive visualizers: tables, charts, maps.
Integration with Microsoft Office.

The Dashboards tool is used to create analytical documents as a combination of interactive interrelated visualizers.
Key features:
Interchangeable visualizers: tables, charts, maps, factors.
Working according to the WYSIWYG principle (What You See Is What You Get), that is, the user sees at once how a dashboard looks like.
Using objects from other tools without applying additional settings.
Analyzing several data sources in one visualizer.
Rich analytical capabilities and adding analysis results to a dashboard thanks to a built-in advanced analytics block.

The Reports tool is used to create reports with complex formatting that are used for printing.
Key features:
Building reports using table and text sheets
Editing data and saving changes to the source
Visualizing data on a text sheet.
Setting up report for printing.
Using interactive controls
Supporting relational, as flat tables, and multidimensional, as crosstabs, data views
Setting up data drill down and drill up, moving from one view to any other, converting from multidimensional to relational data
Integration with Microsoft Office.
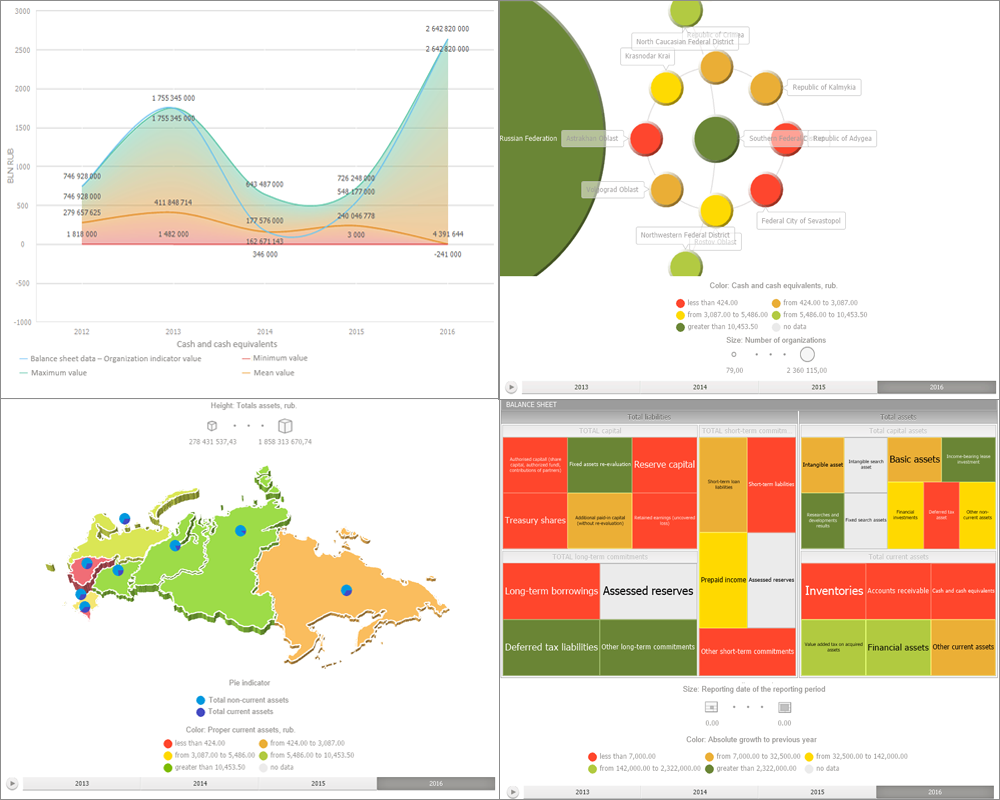
Data analysis and report building tools enable the use of various data visualizers.
Key features:
Table visualizer with the ability to analyze data and set up their appearance.
Charts with the ability to edit and drill down data.
Maps with the ability to drill down data, play animation and work in 3D mode.
Bubble charts, bubble trees and tree maps with the ability to drill down data and play animation.
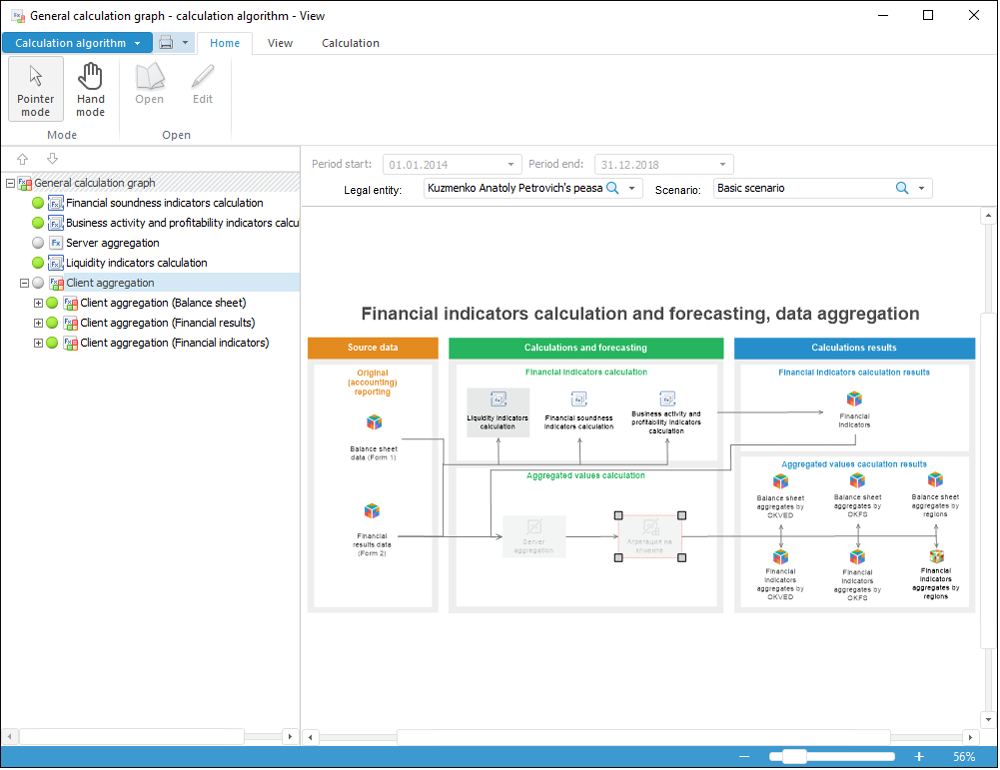
The Calculation Algorithms extension is used to design and perform calculations by practices and algorithms.
Key features:
Creating calculation practices as multilevel graphs on a single graphic space.
Using heterogeneous data sources from repository.
Configurable formula editor with built-in functions and applied script language
Building algorithms on virtual sources (DataSet) without linking to specific data sources.
Parametrized and partial algorithm calculation.
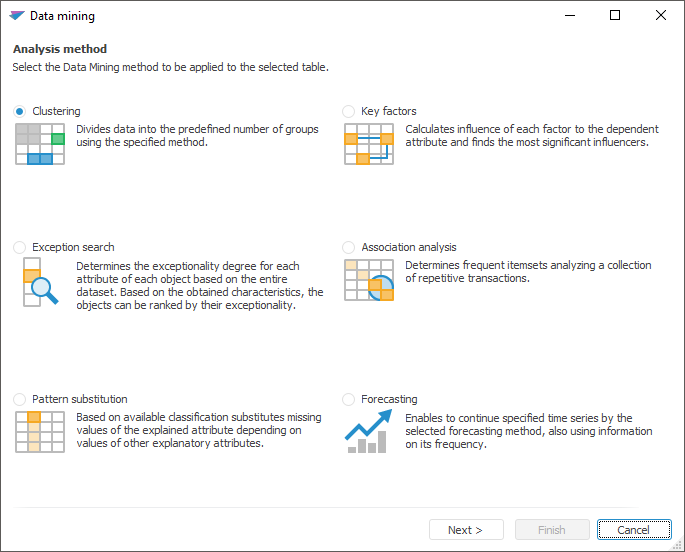
The Data Mining tool is used to process and interpret data in large data arrays.
Key features:
Dividing objects or observations by the specified number of groups based on proximity of their attribute values.
Determining "exceptionality degree" for each attribute of each object based on the total amount of data.
Filling missing values of one attribute depending on the values of other attributes based on the existing classification.
Revealing most significant factors, revealing a degree of influence of each factor on a dependent variable.
Determining often occurring adjacent element sets based on the set of repeated transactions.
Continuing the specified time series by the selected forecasting method by using information about its frequency pattern.
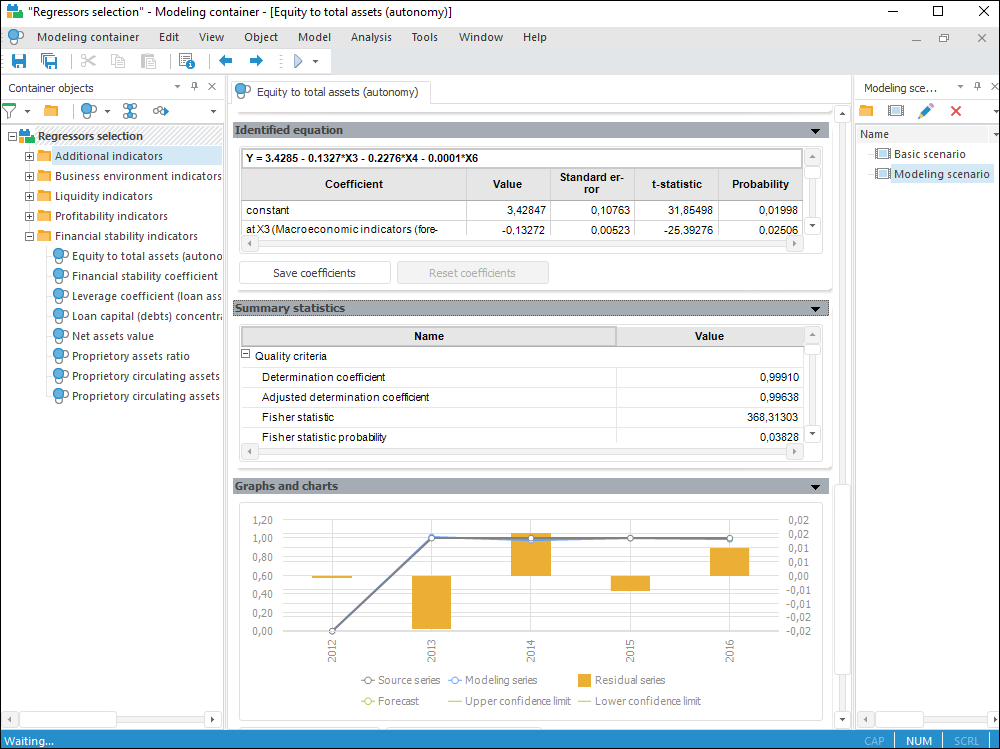
The Modeling and Forecasting tool is intended for advanced users and enables the full use of all Foresight Analytics Platform methods.
Key features:
Descriptive data statistics using various methods: Dickey-Fuller test, Granger test, and so on.
Scenario modeling.
Building models and algorithms using any of Foresight Analytics Platform methods.
Model debug calculation mode to check the correctness of algorithms and error correction.
Writing model code in the R and Python languages.

The Time Series Analysis tool is used to analyze data changing in time.
Key features:
Placing time series on a single workspace with the ability to merge and visually present them.
Checking modeling data quality: detecting outliers, missing data, and so on.
Grouping, sorting and filtering time series, conditional formatting, calculating summary statistics.
Building new time series by means of various models: mathematical formulas, extrapolation, factor analysis, and so on.
Saving configured calculations as models.
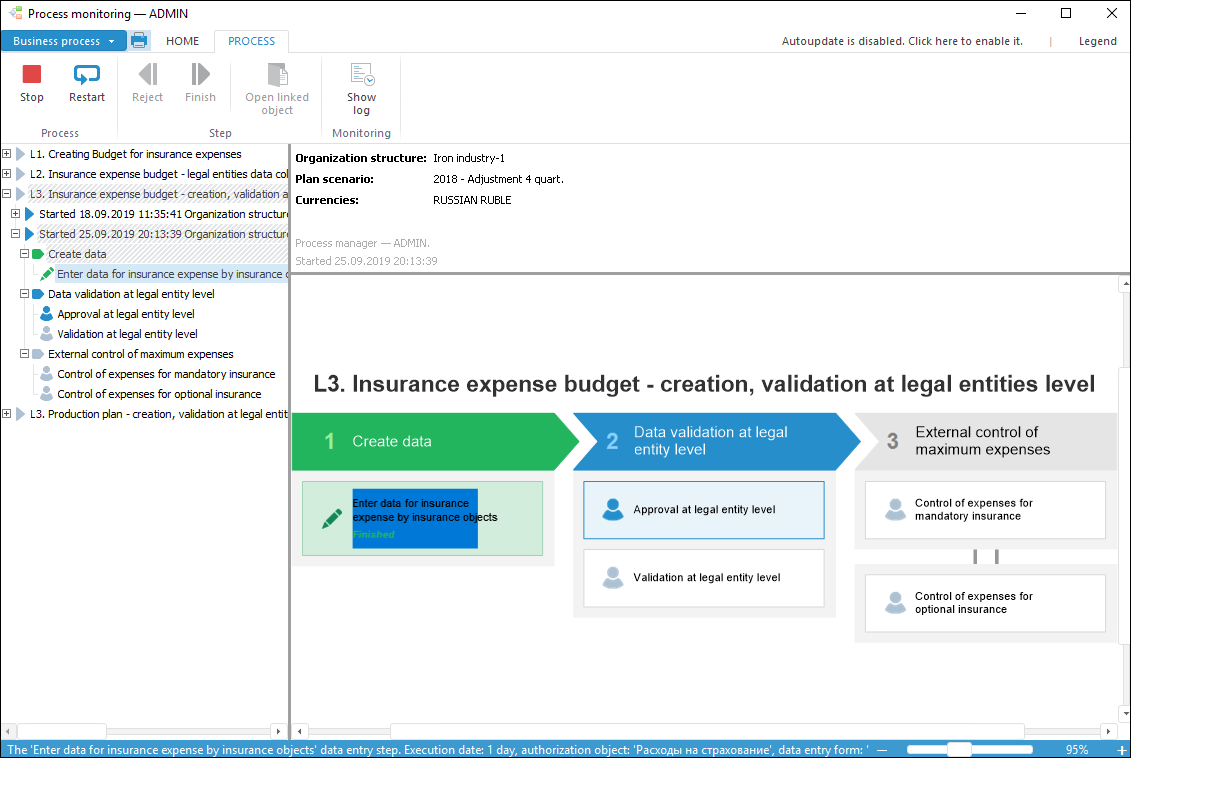
The Business Process Management extension is used for visual modeling of business processes, their execution and monitoring.
Key features:
Creating a process and setting up its stages and steps: execution order and deadlines, parameters, objects for data input, validation and calculation
Assigning process managers and step execution managers
Creating data segments to which access will be provided.
Automatic execution of subprocesses and calculation steps
Executing processes with specified parameters
Visual monitoring of process execution.
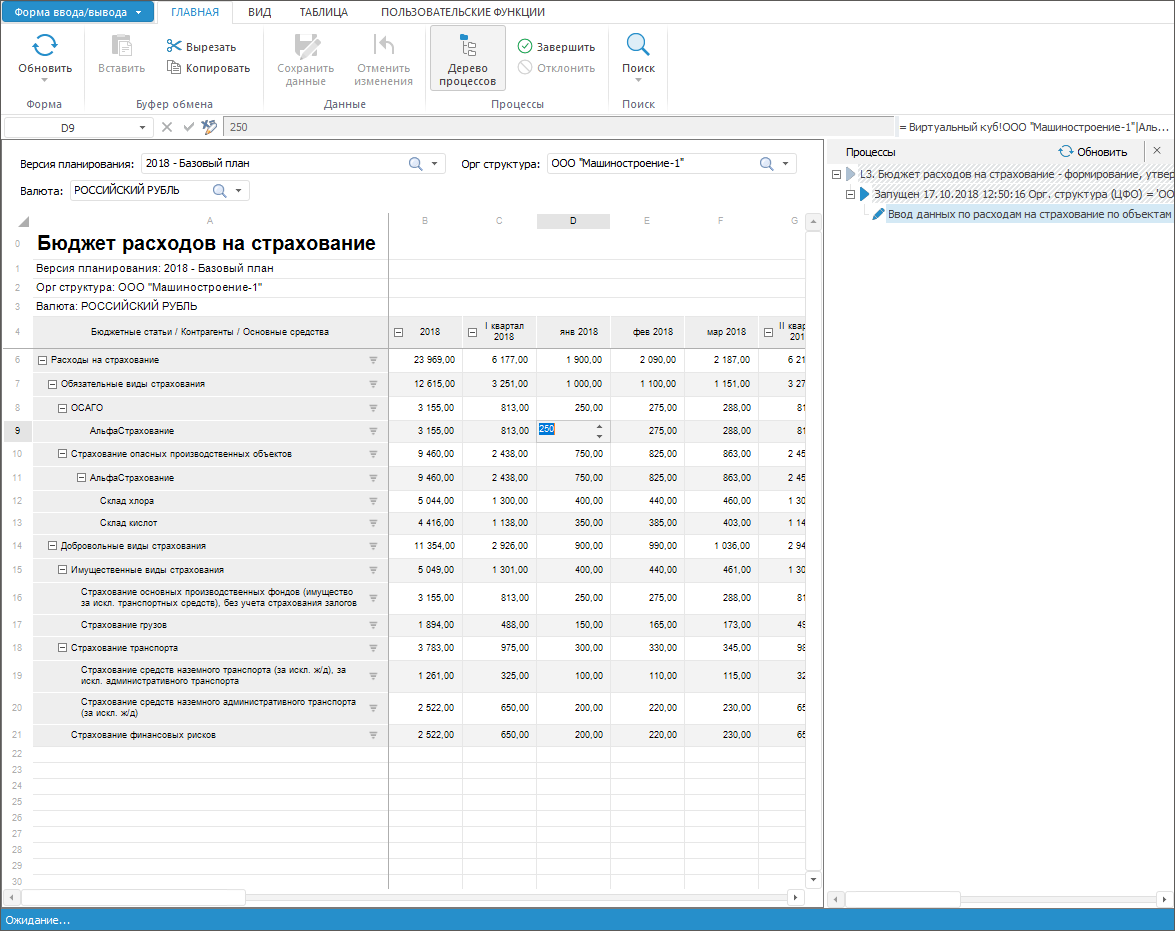
The Interactive Data Entry Forms extension is used to create forms for manual data input, to control input data and calculate factors.
Key features:
Creating interactive multisheet data entry forms: table, registry, card, combined
Flexible form structure and formatting: parameters, heading and sidehead, automatic editors, input masks, filtering, formatting, form print preview, navigation between forms
Using calculation and data control formulas.
Parametrization: dynamic control of contents, setting up links and dimension synchronization, filtering of parameters by attributes.
Enhancing functionality: creating custom folders, connecting Fore functions.
Export to various formats with saving formatting and print options.
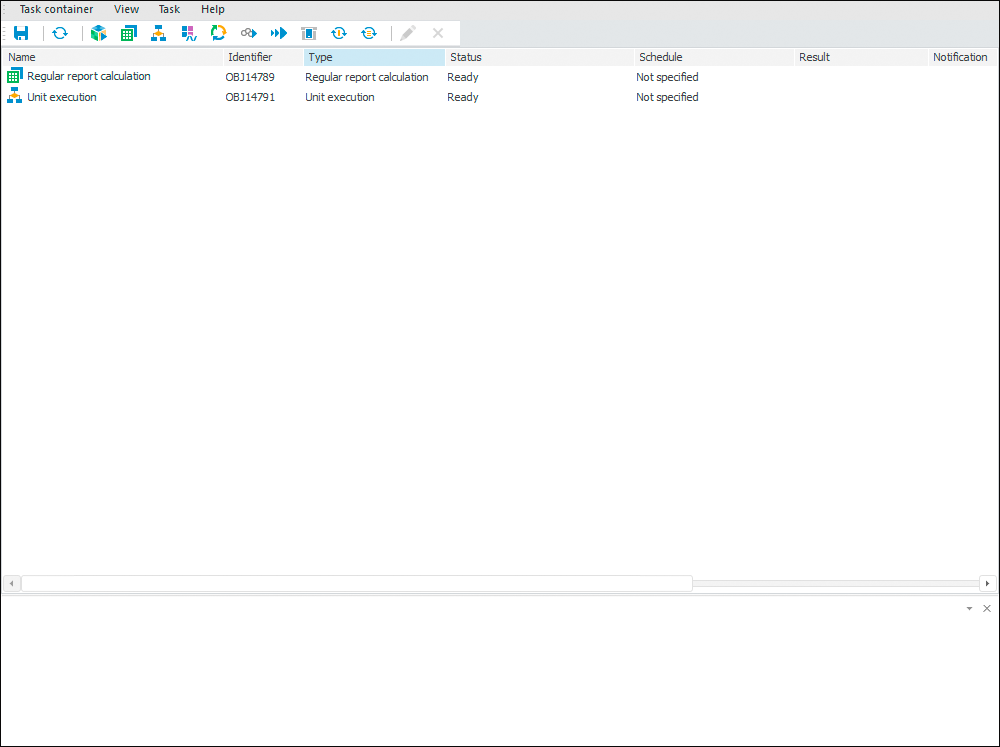
The Task Scheduler tool is used to schedule and execute resource intensive tasks on schedule on server.
Key features:
Executing scheduled resources intensive tasks on server.
Executing tasks on schedule, by condition, on occurring a system event or custom event.
Publishing task execution results on server or sending results results via various channels: email, ftp, SharePoint.
Working in Windows and Linux family operating systems.
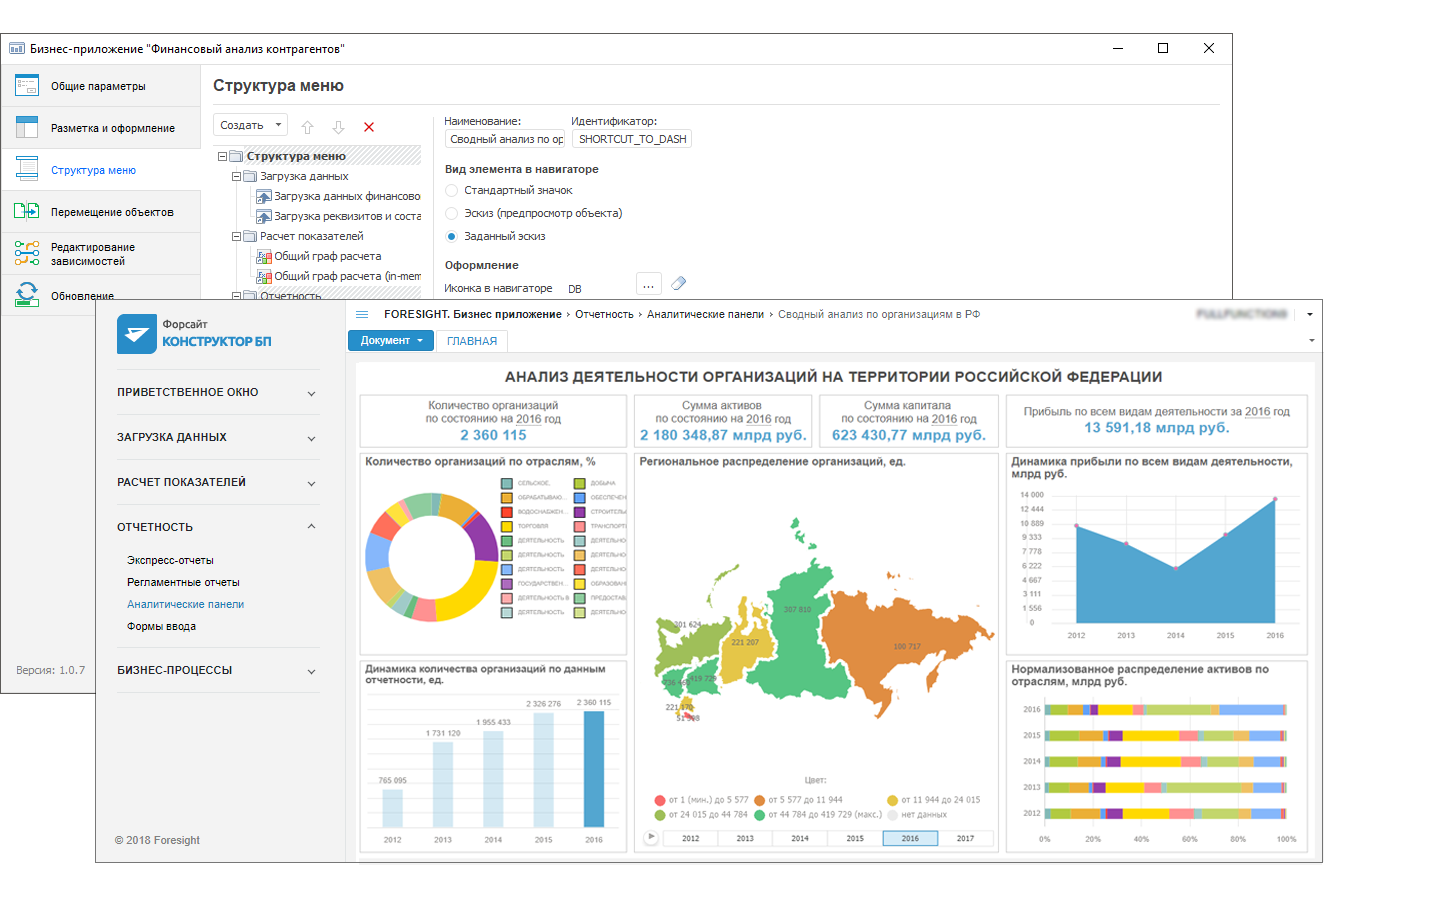
The Designer of Business Application extension is used to create business applications by means of visual design using a standard set of steps.
Key features:
Creating complex multilevel applications.
Typical set of steps to design program products step-by-step.
Supporting business application integrity.
Creating update packages.
Guaranteed application delivery between various systems.
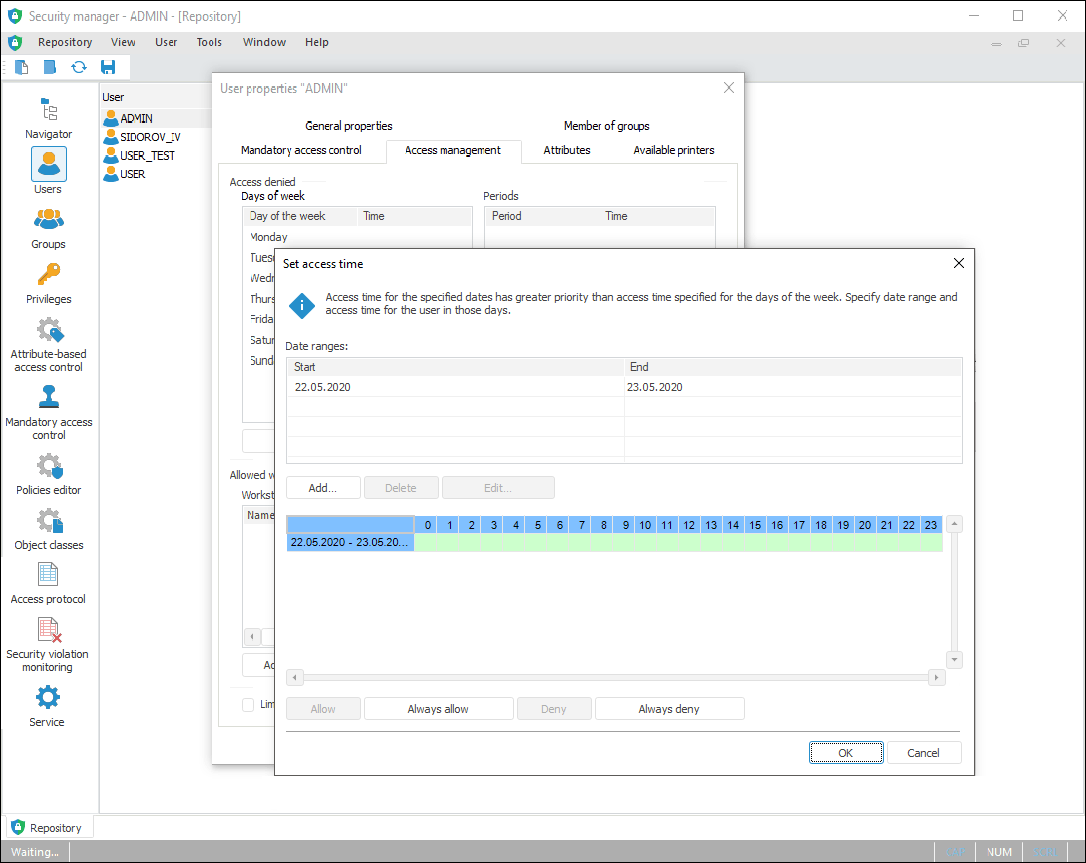
The Security Manager tool is used for administration and access control.
Key features:
Managing user and user group accounts.
Setting up security policy.
Determining properties and access permissions to objects.
Setting up audit and history.
Working with access protocol.
Controlling security policy integrity.
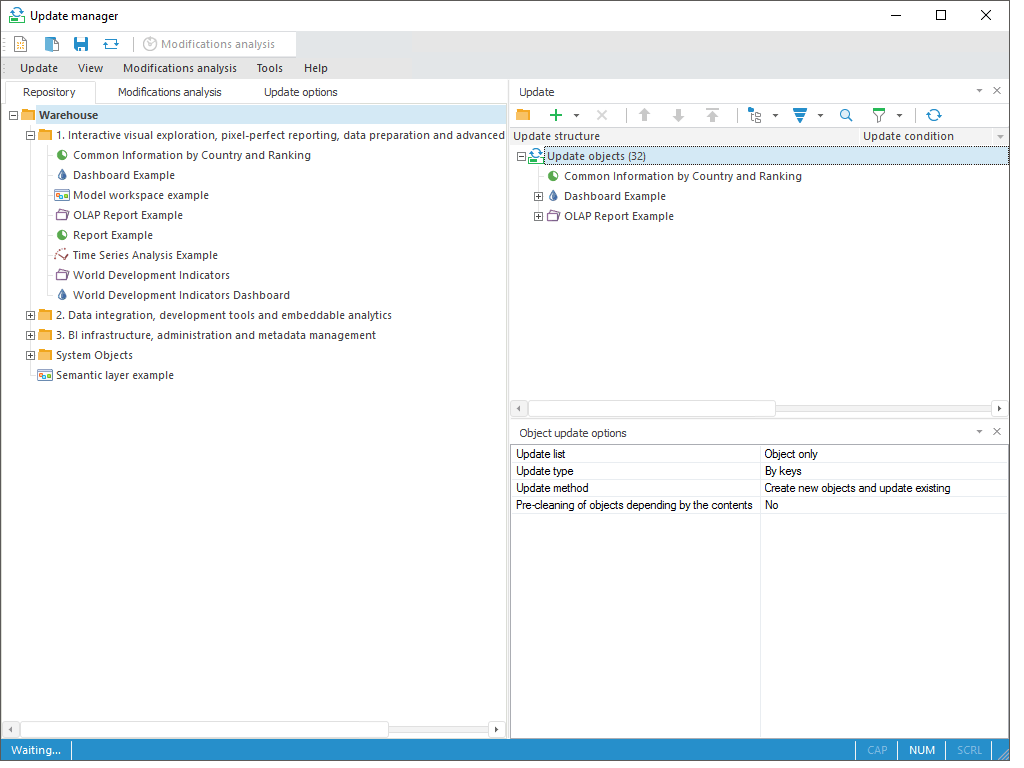
The Update Manager tool is used for synchronization of objects between repositories, and for their update.
Key features:
Synchronizing objects between repositories.
Object modification analysis.
Calculating and performing checksums of updated objects.
Resolving object version conflicts on the update.