To execute the example, create an HTML page and perform the following operations:
1. Add a link to CSS file named PP.css. Also add links to the following JS files:
PP.js.
PP.GraphicsBase.js.
PP.Charts_Canvas.js.
resources.ru.js.
2. Within the <head> tag add a style for the block with the "chart" identifier:
<style type="text/css">
    div#chart {
        border: #CCCCCC 1px solid;
        padding: 1px;
        margin: 1px;
        width: 450px;
        height: 400px;
    }
</style>
3. Then within the <head> tag add a script that creates a scatter chart:
<script>
var chart;
// Creates chart
function createChart() {
    // Create chart
    chart = new PP.Ui.Chart({
        Width: 450, // Chart width
        Height: 400, // Chart height
        ParentNode: "chart",
        Series: [{
            Name: "Australia", // Series name
            Data: getSerieData1(), // Value array
            Color: getColors()[0], // Color
            LineColor: getColors()[4], // Line color
            LineWidth: 2, // Line width
            Marker: getMarker(getColors()[0])
        }, {
            Name: "Asia",
            Data: getSerieData2(),
            Color: getColors()[1],
            LineColor: getColors()[5],
            LineWidth: 2,
            Marker: getMarker(getColors()[1])
        }],
        Type: "Scatter", // Chart type
        // X axis
        XAxis: {
            Categories: ["2001", "2002", "2003", "2004", "2005", "2006"],
            IsX: true,
            Labels: {
                Enabled: true
            }
        },
        // Y secondary axis
        YSAxis: {
            Enabled: false
        }
    });
}
// Returns marker for chart data series
function getMarker(borderColor) {
    var marker = {
        BorderColor: borderColor,
        BorderWidth: 2,
        Color: "rgb(255, 255, 255)",
        Enabled: true,
        Radius: 8,
        Symbol: "Circle",
    };
    return marker;
}
// Creates Y axis for the chart
function createAxis() {
    var axis = new PP.Ui.ChartCanvasAxis({
        AllowDecimals: false, // Disable to use decimal values
        Parent: chart,
        // Set axis position determined by user
        Position: "custom",
        Min: 0,
        Max: 70,
        PlotBands: [],
        PositionValue: -1, // The Y axis is places to the left from the chart construction area
        Primary: true, // This axis is the main one
        // Number of axis intervals
        TickIntervalsCount: 5,
        // Axis title
        Title: {
            Text: "Value",
            DisplayUnit: "M. Rub.",
            Font: new PP.Font(),
            Wrap: PP.Ui.TextWrapping.WrapWithEllipsis,
            Align: "Middle"
        },
        // Disable to use maximum and minimum values by default
        UseDefaultExtremes: false,
        LabelClick: function(sender, args) {
            if (args.Tick) {
                if (args.Tick.getFont().getIsUnderline()) {
                    args.Tick.getFont().setIsUnderline(false);
                } else {
                    args.Tick.setFont(new PP.Font());
                    args.Tick.getFont().setIsUnderline(true);
                }
                this.redraw();
            }
        },
        LabelMouseOut: function(sender, args) {
            if (args.Tick) {
                args.Tick.setColor("rgb(0,0,0)");
                this.redraw();
            }
        },
        LabelMouseOver: function(sender, args) {
            if (args.Tick) {
                args.Tick.setColor("rgb(255,0,0)");
                this.redraw();
            }
        },
        TitleDblClick: function(sender, args) {
            if (args.Axis && args.Axis.getTitle()) {
                console.log("Axis title: «%s»", args.Axis.getTitle().Text);
            }
        }
    });
    // Set up access methods for the Color, Font and ticks properties
    PP.Object.defineProps(PP.Ui.ChartAxisTick, ["Color", "Font"], true);
    PP.Object.defineProps(PP.Ui.ChartCanvasAxis, ["ticks"], true);
    return axis;
}
// Display information about specified chart axis
function printAxisInfo(axis) {
    console.log("Y axis height in pixels: %s", axis.getPixelLength());
    value = 50;
    console.log("Y axis coordinate corresponding to the %s value: %s", value,
        axis.getPixelValue(value));
    console.log("Y axis value corresponding to the %s coordinate: %s", 100,
        axis.getAxisValue(100, true));
    console.log("Value of the axis tick mark: %s", axis.getTickInterval());
    console.log("Lenght of the axis tick nark in pixels: %s", axis.getTickPixelInterval());
    console.log("Y axis width: %s", axis.getSize());
    console.log("Data series linked to the axis:");
    for (var i in axis.getLinkedSeries()) {
        console.log("  %s", axis.getLinkedSeries()[i].getName());
    }
}
// Creates array of colors
function getColors() {
    var colors = [
        "rgb(147,61,168)",
        "rgb(255,217,0)",
        "rgb(255,145,145)",
        "rgb(107,188,128)",
        "rgb(160,203,200)",
        "rgb(195,214,108)",
        "rgb(239,193,100)",
        "rgb(239,193,100)",
        "rgb(255,191,191)",
        "rgb(169,216,181)",
        "rgb(205,227,226)",
        "rgb(223,233,178)",
        "rgb(247,223,175)",
    ];
    return colors;
}
// Returns array of values for the first data series
function getSerieData1() {
    var data = [{
        X: 0,
        Y: 10,
        Name: "2001",
        Color: getColors()[0]
    }, {
        X: 1,
        Y: 30,
        Name: "2002",
        Color: getColors()[1]
    }, {
        X: 2,
        Y: 17,
        Name: "2003",
        Color: getColors()[2]
    }, {
        X: 3,
        Y: 25,
        Name: "2004",
        Color: getColors()[3]
    }, {
        X: 4,
        Y: 55,
        Name: "2005",
        Color: getColors()[4]
    }];
    return data;
}
// Returns value color for the second data series
function getSerieData2() {
    var data = [{
        X: 0,
        Y: 15,
        Name: "2001",
        Color: getColors()[5]
    }, {
        X: 1,
        Y: 24,
        Name: "2002",
        Color: getColors()[6]
    }, {
        X: 2,
        Y: 19,
        Name: "2003",
        Color: getColors()[7]
    }, {
        X: 3,
        Y: 29,
        Name: "2004",
        Color: getColors()[8]
    }, {
        X: 4,
        Y: 28,
        Name: "2005",
        Color: getColors()[9]
    }];
    return data;
}
function onReady() {
    // Create scatter chart
    createChart();
    // Create Y axis
    var yAxis = createAxis();
    // Set this axis
    chart.setYAxis(yAxis, true);
    // Redraw the chart
    chart.redraw(true);
    // Display information about Y axis
    printAxisInfo(yAxis);
}
</script>
4. Within the <body> tag specify name of the function creating a chart as the value of the onLoad attribute, and also add a block with the "chart" identifier:
<body onload="onReady()">
    <div id="chart"></div>
</body>
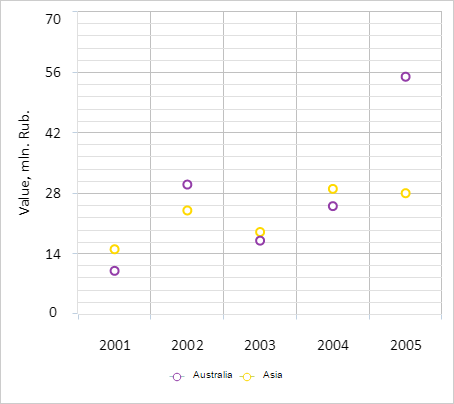
After executing the example a scatter chart is placed on the HTML page:
The browser console shows information about vertical axis of the chart:
Pixel length of Y axis: 302
Y axis coordinate corresponding to the value 50: 86.28571428571428
Y axis value corresponding to the coordinate 100: 49.139072847682115
Value of an axis tick interval: 14
Pixel length of an axis tick interval: 60.4
Y axis width: 66.21875
Data series linked to the axis:
Australia
Asia
See also: