ItemsVisibilityChanged: function(sender, args);
sender. Event source.
args. Event information.
The ItemsVisibilityChanged event occurs on toggling visibility of a chart data series.
Executing the example requires that the HTML page contains the Chart component named chart (see Example of Creating a Histogram). Add a handler of the ItemsVisibilityChanged event:
// Set handler of the ItemsVisibilityChanged event
chart.ItemsVisibilityChanged.add(function() {
    // Get number of data series shown as columns ignoring invisible series
    var count = chart.getColumnSeriesCount(false);
    // Show the value to the browser console
    console.log("Number of visible data series shown as columns: " + count);
});
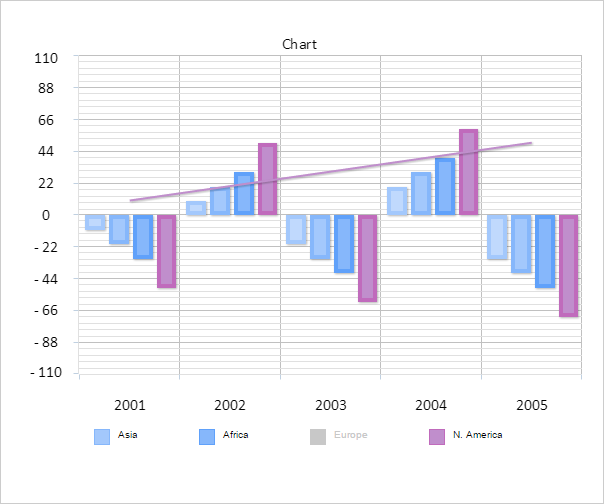
Left-click one of the legend markers. This hides one of the data series from the legend:
The browser console shows the number of visible data series shown as columns:
Number of visible data series shown as columns: 4
See also: