In Foresight Analytics Platform, data analysis and building reports are executed by means of various tools. The analysis results in the generated reports including interactive ones, which are used to pass data to end users: managers, analysts, and so on.
The Analytical Queries (OLAP) tool is used to form ad-hoc queries to data and execute analysis using business graphics tools and various analytical functions.
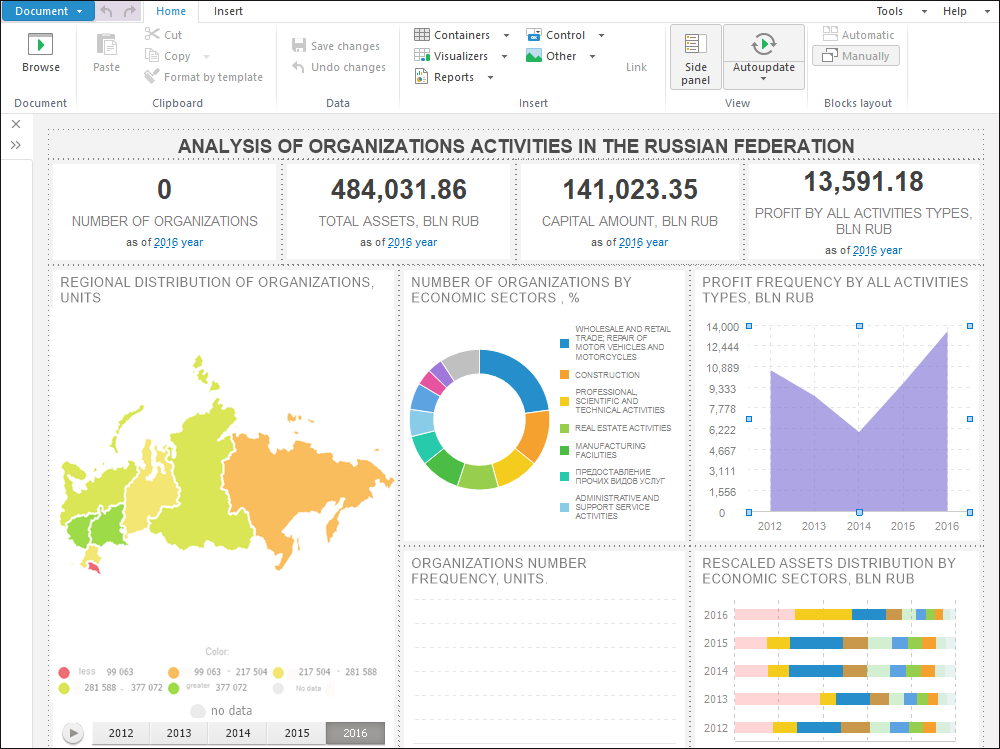
The Dashboards tool is used to present analytical documents based on information from various data sources by means of interrelated visualizers.
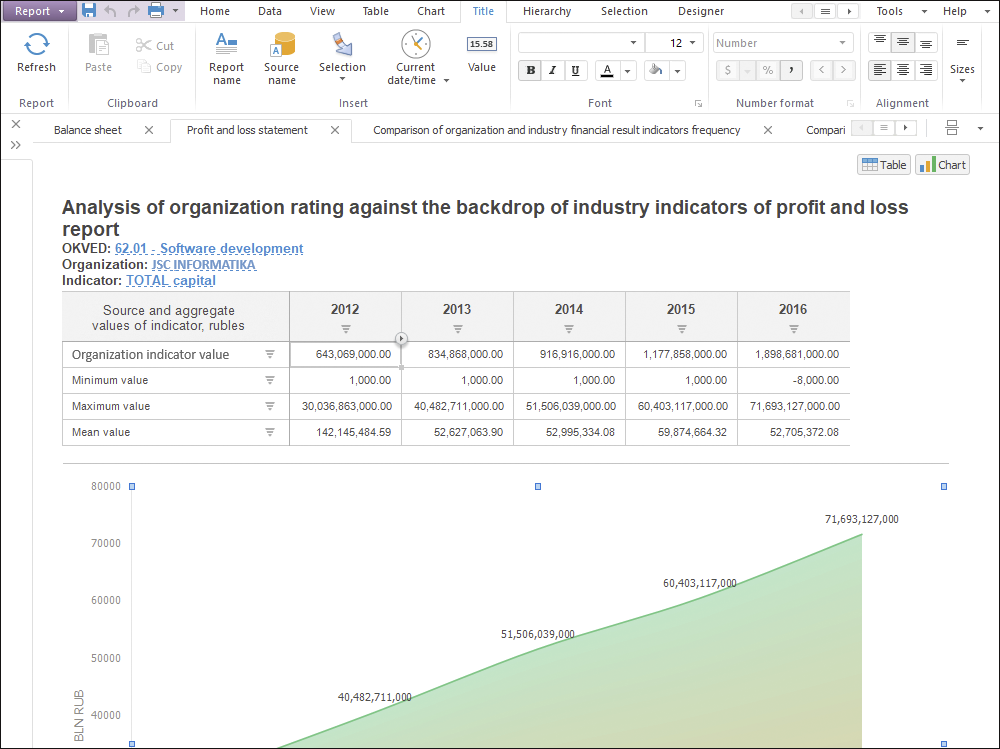
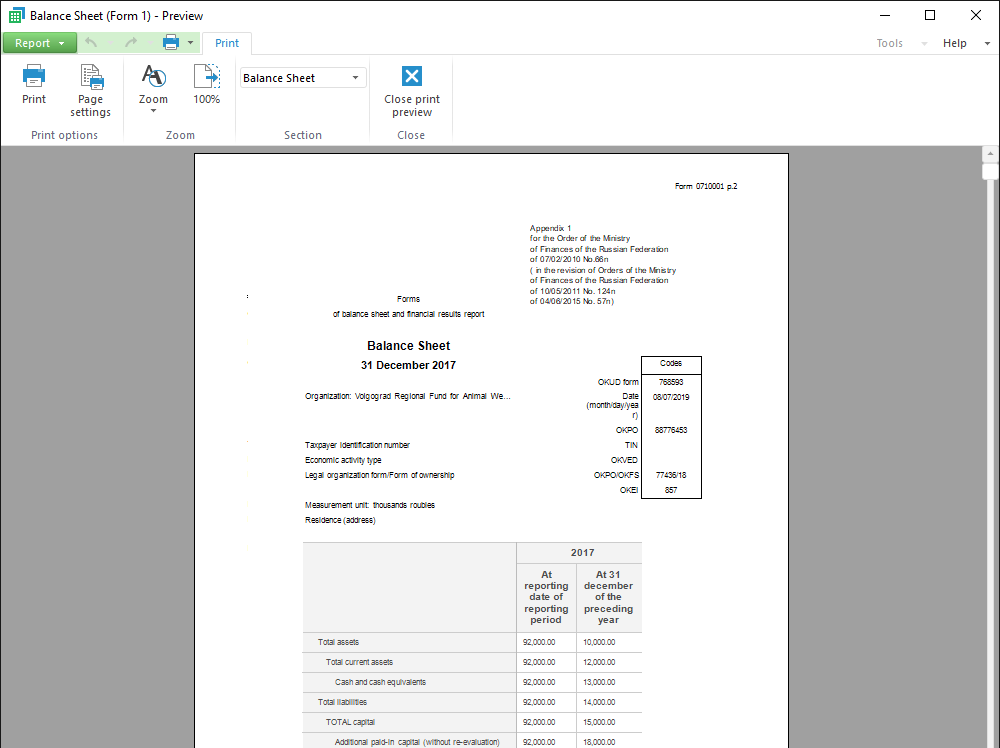
The Reports tool is used to generate reports with the arbitrary structure of data presentation, which enables the user to combine table data, text, business graphics and various visualizers.
Foresight Analytics Platform tools enable the user to work with various visualizers that display data. If data is changed in the data source, data in all visualizers is automatically changed.