To create a data area:
On the Data Sources and Data Slices panel select the required slice and drag it to the report sheet.
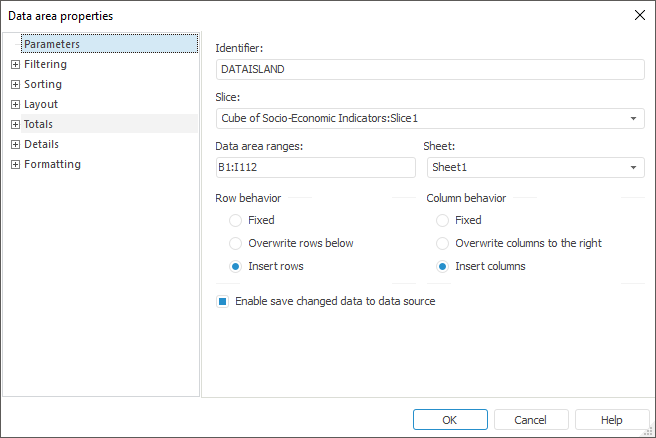
In the Data Area Properties dialog box on the Parameters tab set the following values:
In the drop-down slice menu select Cube of Socio-Economic Indicators: Slice1.
Set data area borders B1:D6.
Select Sheet1 in the drop-down list of available sheets.
Select the Insert Rows checkbox in the Row Behavior groupbox.
Select the Insert Columns checkbox in the Column Behavior groupbox.
Select the Enable Save Changed Data to Data Source checkbox.
When these operations are executed, the Parameters page looks as follows:
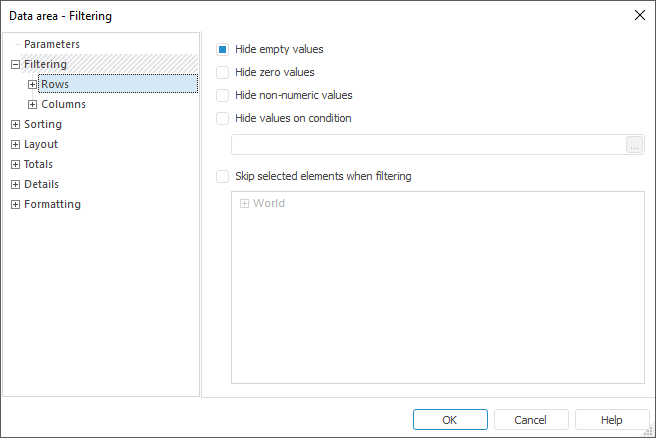
The next step is defining parameters for data filtering. Define filters for rows and columns on the Filtering tab:
Select the Hide Empty Values checkbox on the Rows and Columns tabs.
After executing these operations the Filtering tab looks as follows:
The example of data area without filtering:

After filtering application, data area looks as follows:

Do not change parameters on the Sorting tab.
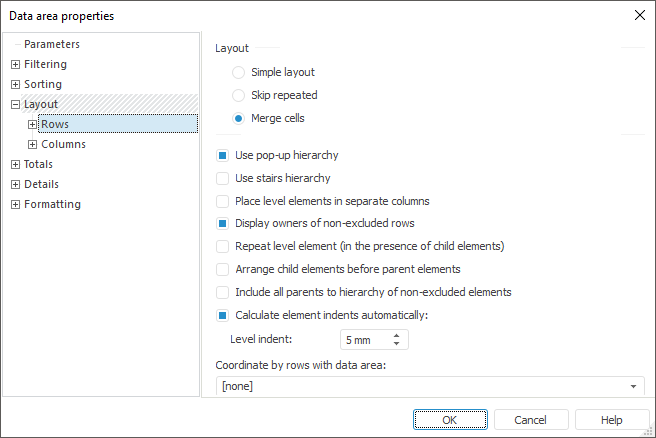
On the Layout > Rows tab select the checkboxes:
Use pop-up hierarchy.
Display owners of non-excluded rows
Calculate element indents automatically.
After these checkboxes are selected, the Layout tab looks as follows:
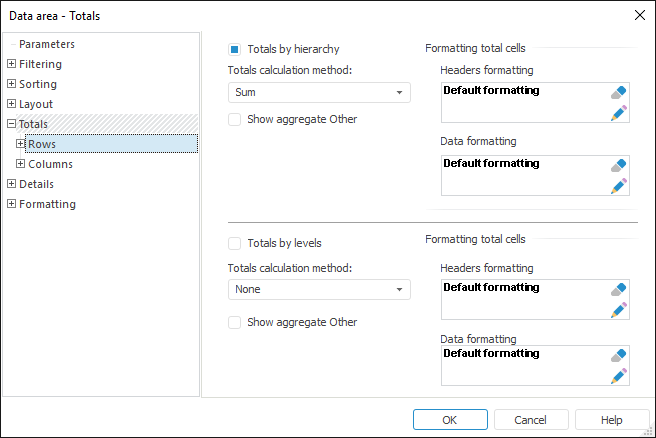
Set up totals by rows on the Totals tab:
Select the Totals by Hierarchy checkbox.
Select Sum as the totals calculation method.
After these parameters are set, the Totals > Rows tab looks as follows:
To set formatting for the totals cells, click the  button to open the Cell Format dialog box.
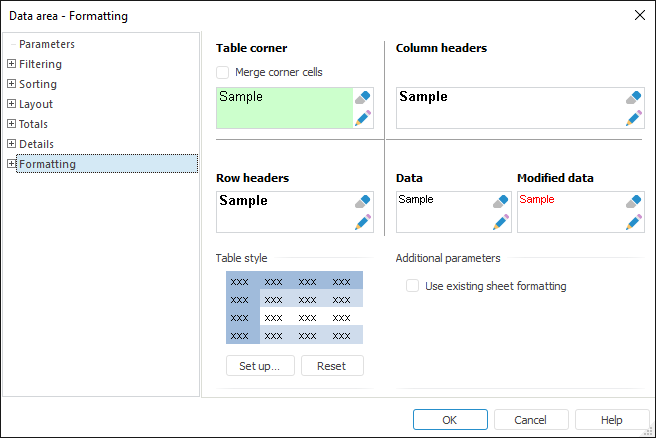
Determine data area formatting on the Formatting tab:
Refresh the report. After the report is refreshed, the data area looks as follows:

Press CTRL + F9 to start report calculation and open the report in the view mode after calculation is completed.
See also: