Go to the Home or Data ribbon tab.
Click the ![]() Visualizer Data button and select the view building option:
Visualizer Data button and select the view building option:
The Analytical Queries (OLAP) tool enables the user to rebuild visualizers built on the same data source as the table, on selecting a table cell range in the data table.
To select a table area, by which visualizers are built:
Go to the Home or Data ribbon tab.
Click the ![]() Visualizer Data button and select the view building option:
Visualizer Data button and select the view building option:
Entire Table. Visualizers are built by the entire table.
Selected Area. Visualizers are built by the data selected in the table.
Features of building visualizers by the selected table area:
If one cell or corner is selected in the table, views are built based on the entire data table.
If several cell ranges are selected in the table by means of the CTRL key, joined selection by all selected cells ranges is passed to the views.
Changing source dimensions and/or selection may result in the shift of selection of data table areas, therefore, visualizers are rebuilt.
After setup, visualizers are rebuilt according to the set parameters.
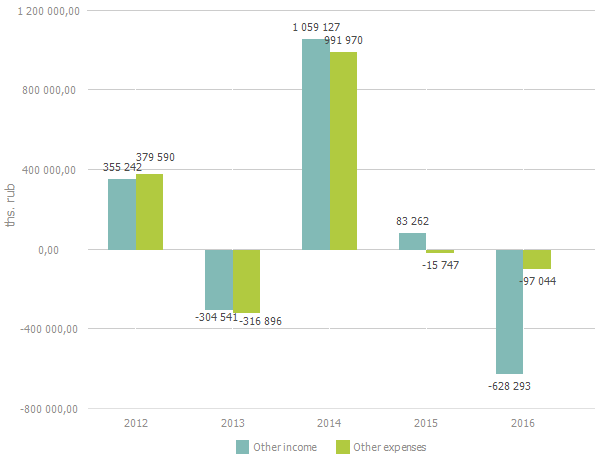
Consider an example of building a chart based on the selected range. A table with the selected range looks as follows:

A chart built on this range looks as follows:

See also: