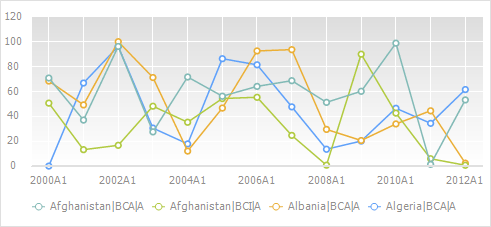
A chart is used for graphic presentation of table data. For example:![]()
Basic operations with chart are described below. For detailed description of features see the Setting Up Chart Components section.
 Select data table area, by which a chart is plot
Select series displayed on the chart
Change data transfer method to the chart
See also:
Description of Time Series Analysis Interface
