getForecastRange();
The getForecastRange method returns maximum range of backward and forward forecast for the chart.
The method returns an object with the following fields:
max. Maximum forward forecast of the chart.
min. Maximum backward forecast of the chart.
Executing the example requires that the HTML page contains a Chart component named chart (see Example of Creating a Histogram). Hide chart trend lines and get maximum backward and forward forecast for the chart:
// Hide chart trend lines
chart.hideTrendLines(false);
// Get maximum  backward and forward forecast for the chart
var forecastRange = chart.getForecastRange();
// Display maximum backward and forward forecast to the browser console
console.log("Maximum backward forecast: " + forecastRange.min);
console.log("Maximum forward forecast: " + forecastRange.max);
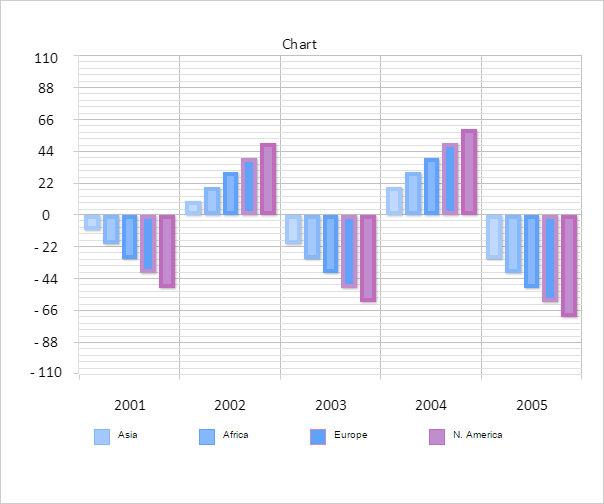
After executing the example trend lines in the chart are hidden:

The browser console displays maximum values for backward and forward forecast:
Maximum backward forecast: 0
Maximum forward forecast: 4
See also: