DisplayHidden: Boolean;
DisplayHidden: Boolean;
The DisplayHidden property determines whether hidden columns and rows are to be shown on a chart.
If the property is set to True, the chart shows all the values available in the data table, if the property is set to False, hidden rows and columns are excluded from the chart plot area, as well as the rows and columns with zero height or width.
See below the table with a hidden row:

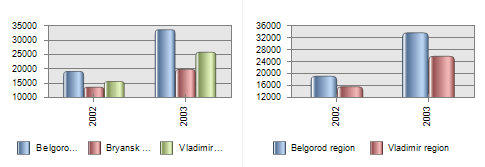
Below are examples of a chart for this table with the DisplayHidden property set to True (left) and to False (right):

Executing this example requires a form, a button named Button1 positioned on this form, the UiErAnalyzer component named UiErAnalyzer1, used as a data source for the components TabSheetBox and ChartBox.
Sub Button1OnClick(Sender: Object; Args: IMouseEventArgs);
Var
ErAnalyzer: IEaxAnalyzer;
Chart: IEaxChart;
TabSheet: ITabSheet;
TabRange: ITabRange;
Begin
ErAnalyzer := UiErAnalyzer1.ErAnalyzer;
TabSheet := ErAnalyzer.Grid.TabSheet;
TabRange := TabSheet.Row(2);
TabRange.Hidden := TriState.OnOption;
Chart := ErAnalyzer.Chart;
Chart.DisplayHidden := False;
End Sub Button1OnClick;
After executing this example third row of the table is hidden. The chart based on this table will not show hidden rows.
Executing this example requires a form, a button named Button1 positioned on this form, the UiErAnalyzerNet component named UiErAnalyzerNet1, used as a data source for the components TabSheetBoxNet and ChartBoxNet.
Private Sub button1_Click(sender: System.Object; e: System.EventArgs);
Var
ErAnalyzer: IEaxAnalyzer;
Chart: IEaxChart;
TabSheet: ITabSheet;
TabRange: ITabRange;
Begin
ErAnalyzer := UiErAnalyzerNet1.ErAnalyzer;
TabSheet := ErAnalyzer.Grid.TabSheet;
TabRange := TabSheet.Row[2];
TabRange.Hidden := TriState.tsOnOption;
Chart := ErAnalyzer.Chart;
Chart.DisplayHidden := False;
End Sub;
After executing this example third row of the table is hidden. The chart based on this table will not show hidden rows.
See also: