Mobile Application
In this article:

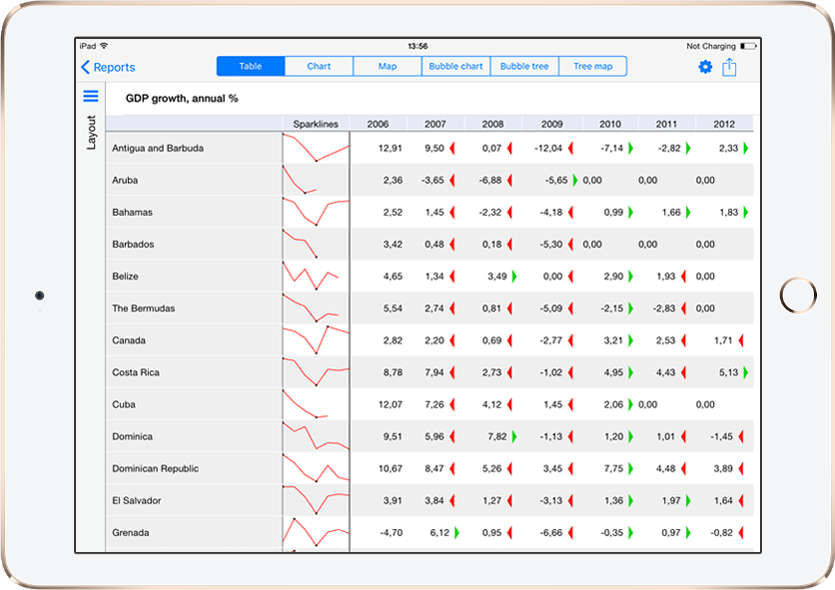
The Analytical Queries (OLAP) tool is used to quickly view and analyze data "on the fly" and display data by means of business logic.
Key features:
Setting up data source dimensions.
Selecting displayed data.
Flexible visualizer setup: tables, charts, maps, and so on.
Executing data analysis.
Using Apple maps.
Saving reports.

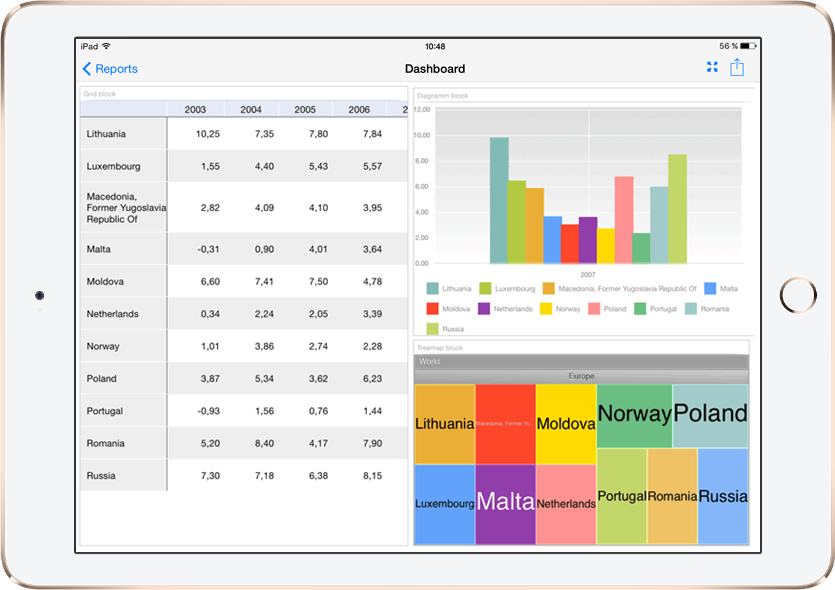
The Dashboard tool is used to create analytical documents as a combination of interactive interrelated visualizers.
Key features:
Selecting displayed data.
Flexible visualizer setup: tables, charts, maps, and so on.
Executing data analysis.
Using Apple maps.
Saving dashboards.

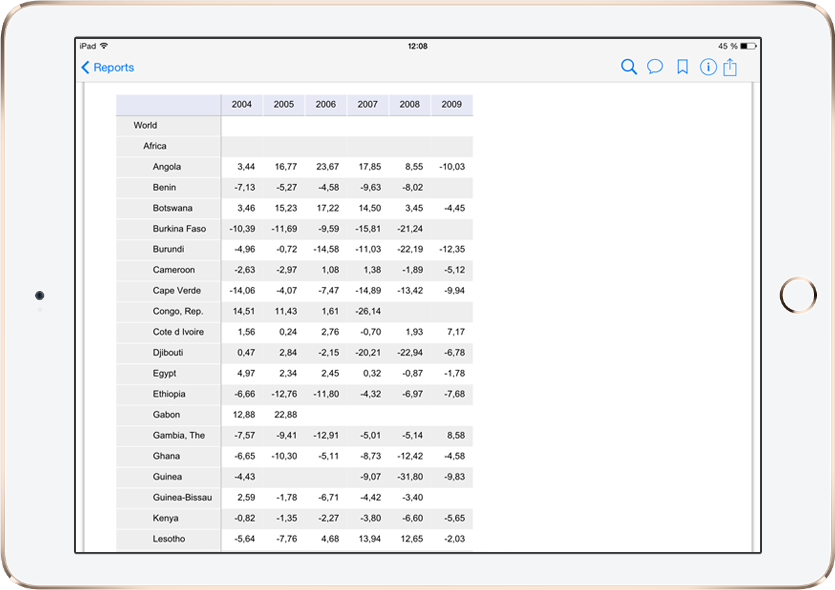
The Reports tool is used to view reports with complex formatting that are used for printing.
Key features:
Using interactive controls.
Search in the report sheet.
Adding notes and bookmarks.
Navigating report sheets.
Saving reports.