Operating system requirements: iOS 5.0 or later.
Mobile device: iPad.
This example describes some methods of working with data series setup controller. After starting the example the following operations are executed:
A chart trend line is created by means of a data series specified as a data source.
A data series setup controller is created.
Trend line value is set for the created controller.
Executing the example requires to place the following code in the body of the executeExample method of the ViewController class (see the Displaying of Express Report section):
// Get array of data view controllers
NSArray *controllers =[m_controller dataViewControllers];
// Select chart as the current view
[m_controller setDataViewControllerWithIndex: 1];
// Parse data view controllers in cycle
for(NSObject *controller in controllers)
{
    // Check if the current controller is controller of chart data view
    if([controller isMemberOfClass:[MAChartDataViewController class]])
    {
        // Get data view controller object as a chart
        MAChartDataViewController *chartController = (MAChartDataViewController *)controller;
        // Get controller view
        UIView *view = [chartController view];
        // Check if the current view is data view as a chart
        if([view isMemberOfClass:[Chart class]])
        {
            // Get chart data source
            ChartDataViewDatasource *datasource = [[chartController dataSource] datasource];
            // Get the key corresponding to a data series with the 1 index
            NSString *key = [NSString stringWithFormat:@"%@", [[datasource seriesKeys] objectAtIndex: 1] ];
            // Get data view as a chart
            Chart *chart = (Chart *)view;
            // Create a trend line
            TrendLine *line = [[TrendLine alloc] init];
            // Add trend line into data view as a chart
            [chart addTrendLine:line];
            // Set trend line data source
            line.dataSource = [chartController dataSource];
            // Set data series key, based on which trend line is built
            [line setDataIndex:key];
            // Set trend line color
            line.color = [UIColor blueColor];
            // Set trend line thickness
            line.thickness = 2;
            // Determine whether trend line name is formed automatically
            line.autoName = YES;
            // Refresh trend line data
            [line updateData];
            // Create a data series setup controller with the 1 index by means of data view controller as a chart
            ChartRowViewController *row = [[ChartRowViewController alloc] initWithDelegate:chartController index:1];
            // Set trend line value for data series setup controller
            [row setTrendLine:line];
            // Set the view, in which trend line is displayed
            [[row trendLine] setChartView:chart];
            break;
        }
    }
}
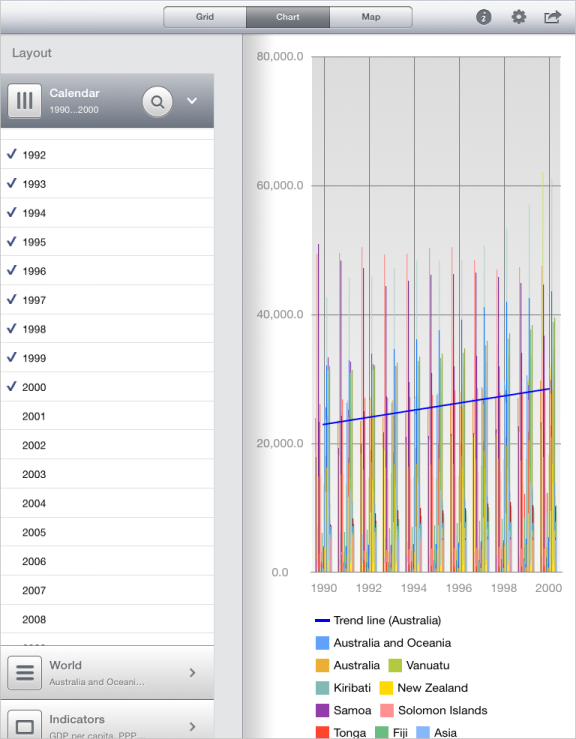
After executing the example the express report is displayed containing the chart displaying the trend line for the specified data series:
Then it is required to place in the body of the executeExample method before the strings:
// Set the view, which displays trend line
[[row trendLine] setChartView:chart];
the following code:
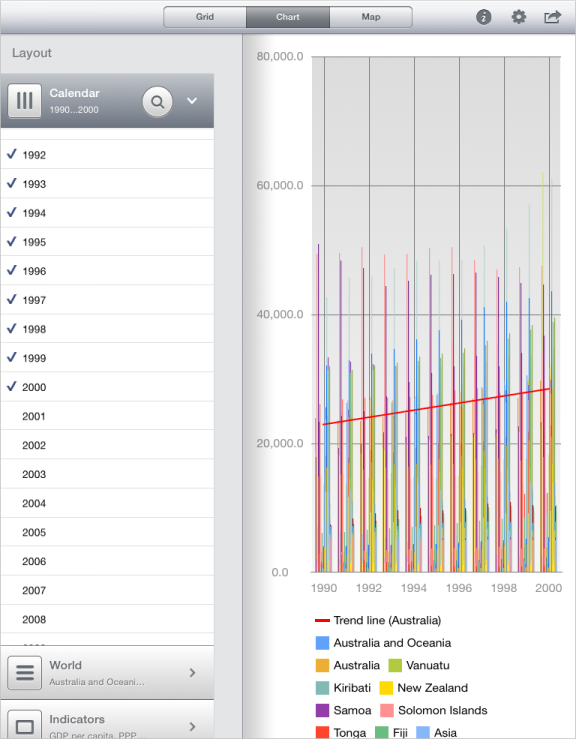
// Set new value of trend line color
[[row trendLine] setColor: [UIColor redColor]];
After executing the updated example trend line color for the specified chart data series is changed:
See also: