Operating system requirements: iOS 5.0 or later.
Mobile device: iPad.
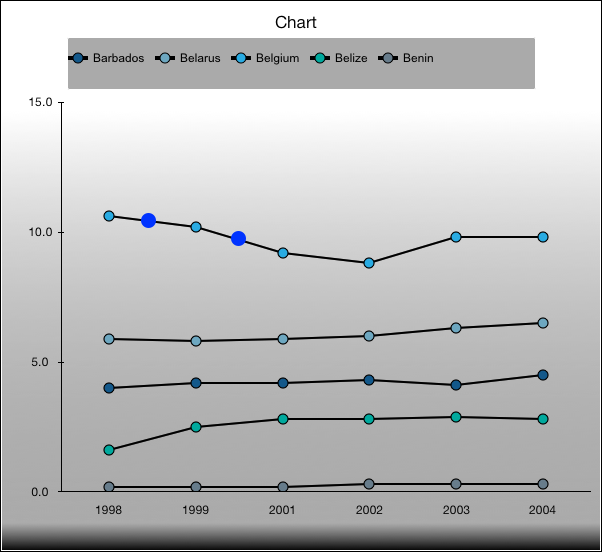
This example implements drawing of data series point markers in the custom view, and also the development environment console displays whether a point is in the specified marker area.
Executing the example requires to place the following code instead of the chartTouchesTapInView: withPoint: method of the ViewController class (see the Chart Gradient Fill section):
// Handle table area touch event
- (void )chartTouchesTapInView:(UIView *)v withPoint:(CGPoint)point{
    // Get a data series
    ChartSeries *series = [chart seriesList][0];
    // Get data series point
    LinePoint *lPoint = [[series points] objectForKey:[NSNumber numberWithInt:4]];
    // Get series point marker
    ChartMarker *marker = [lPoint marker];
    // Create area objects and area point objects
    CGRect r = CGRectMake(50, 50, 200, 200);
    CGPoint p = CGPointMake(150, 150);
    // Get whether the specified point is in the specified marker area
    BOOL b = [marker markerWithRect:r containsPoint:p];
    NSLog(@"%@ %hhd",@"Indicates whether the specified point is ni the specified marker area:", b);
    // Determine custom view
    CustomView *cView = [CustomView new];
    // Set chart
    [cView setChart:chart];
    // Set view drawing area
    [cView setFrame:CGRectMake(130, 200, 200, 200)];
    // Draw view
    [[self view] addSubview:cView];
}
Click the chart area.
As a result, additional markers are displayed:
The development environment console also displays a message that the point is found in the specified marker area:
Indicates whether the specified point is in the specified marker area: 1
See also: