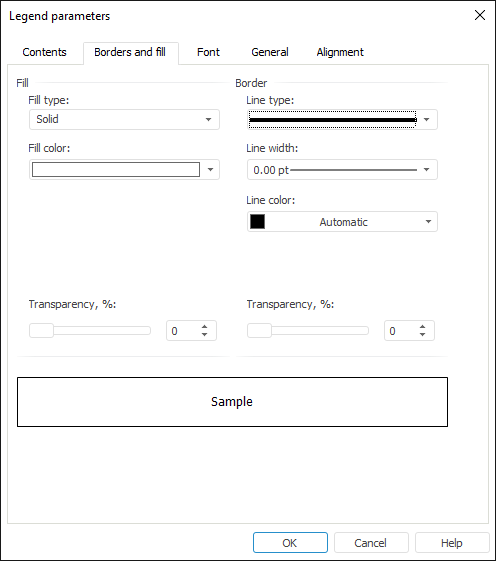
To set up common legend borders and fill, go to the Borders and Fill tab of the Legend Parameters dialog box.

 To open the Legend Parameters dialog box
Select the Legend Parameters context menu item of common chart legend.

Determine the following parameters on the tab:
Set legend fill format. Select the fill type in the Fill Type drop-down list. The set of parameters to set up changes depending on the selected type:
None. When this option is selected, no fill is used.
Solid. In the Fill Color drop-down palette select a color to use as the solid fill, or click the Custom button to select a new color in the advanced color palette.
Gradient. Determine the following parameters:
Color 1. Select start gradient color in the drop-down palette.
Color 2. Select end gradient color in the drop-down palette.
Gradient Angle. Set gradient tilt angle. Available values [-359; 359].
Image. This option enables the use of a specified image as the fill. To select an image, click the ![]() button in the Image File box.
button in the Image File box.
Pattern. This option enables the use of both solid fill and pattern at the same time. Determine the following parameters:
Fill Color. Choose fill color in the drop-down palette.
Pattern Color. Select pattern color in the drop-down palette.
Pattern. Select pattern type in the drop-down list.
Transparency. Set fill transparency in percents. 100% refers to full transparency (fill becomes invisible), 0% refers to full opacity. Use a slider or value editor to set the required value.
NOTE. The parameter is not available for the Image fill format.
Use this group to set border parameters for the Chart Legend object:
Line Type. Select line type in the drop-down list.
Line Width. Select the required line width in the drop-down list. Selecting the Custom item opens the Line Width dialog box, where the user can select the required line width manually or using a value editor.
NOTE. Line width can be specified in different measurement units, but the edit box always shows the value in points (1/72 inch).
Line Color. In the drop-down palette select the border line color, or click the Custom button and select a new color in advanced color palette.
Transparency. Determine line transparency. A value of 100% means full transparency (the line becomes invisible) and the value of 0% means full opacity. Use a slider or value editor to set the required value.
This area shows how the legend fill will look, after the specified parameters are applied.
Make sure that the legend appearance corresponds to the expected result.
See also:
Setting Up Common Chart Legend