Operating system requirements: iOS 5.0 or later.
Mobile device: iPad.
This example describes some methods of working with a chart data view. After starting the example the following operations are executed:
A chart data view controller is created.
A new chart type is set.
It is determined whether chart label font is reduced.
A chart data source is retrieved.
It is retrieved whether chart can be zoomed.
It is retrieved whether chart elements that do not fit are hidden.
Value of coefficient of the relation between chart area size and size of its elements, at which the elements should be hidden.
Chart settings file name is retrieved.
Executing the example requires to place the following code in the body of the executeExample method of the ViewController class (see the Displaying of Express Report section):
// Get array of data view controllers
NSArray *controllers =[m_controller dataViewControllers];
// Parse data view controllers in cycle
for(NSObject *controller in controllers) {
    // Check if the current controller is a chart data view controller
    if([controller isMemberOfClass:[MAChartDataViewController class]]) {
        // Get chart data view controller object
        MAChartDataViewController *chartController = (MAChartDataViewController *)controller;
         // Display chart data view
        [self showViewControllerInNavigationController: chartController];
        // Set new chart type
        [chartController setChartType: kAreaAbsolute];
        // Specified that chart is displayed in full-screen mode
        [chartController setIsFullScreen:NO];
        // Load chart data view
        [chartController loadView];
        // Get chart data source
        ChartDataSourceImpl *chartDatasource = [chartController dataSource];
        // Get chart data series name for specified index
        NSString *seriesName = [chartDatasource seriesNameWithIndex: 1];
        // Get whether chart can be zoomed
        BOOL zoomEnabled = [chartController zoomEnabled];
        // Get whether chart elements that do not fit are hidden
        BOOL optimizeOn = [chartController optimizeOn];
        /* Get value of coefficient of the relation between chart area size
        and size of its elements, at which  elements should be hidden */
        BOOL contentOptimizationFactor = [chartController contentOptimizationFactor];
        // Get chart settings file name
        NSString *settingsPlistName = [chartController settingsPlistName];
        // Display information about chart data view size in the development environment console
        NSLog(@"Chart series name for the index 1 in data source: %@", seriesName);
        NSString *zoomEnabledMess = zoomEnabled? @"enabled": @"disabled";
        NSLog(@"Whether chart can be zoomed: %@", zoomEnabledMess);
        NSString *optimizeOnMess = optimizeOn? @"elements are hidden": @"elements are not hidden";
        NSLog(@"Whether chart elements that do not fit are hidden: %@", optimizeOnMess);
        NSString *contentOptimizationFactorMess = contentOptimizationFactor? @"1": @"0";
        NSLog(@"Value of coefficient of the relation between chart area size and size of its elements, at which elements should be hidden: %@",contentOptimizationFactorMess);
        NSLog(@"Chart settings file name: %@", settingsPlistName);
    }
}
It is also required to replace the code in the static example file MAExpressAnalysisReportViewControllerFactory.mm in the createReport: method in the block:
if (delegate.isChartEnabled)
with the following code:
// Create a chart data view controller
MAChartDataViewController *controller = [[MAChartDataViewController alloc] initWithDatasource:(ChartDataViewDatasource *)delegate.chartDatasource];
// Set title visibility
controller.isDataViewTitleVisible = !!delegate.olapReport->title();
// Set controller delegate
controller.delegate = report;
// Set controller tag
controller.tag = kViewModeChart;
// Set value of coefficient of the relation between chart area size and size of its elements, at which elements should be hidden
controller.contentOptimizationFactor = 0;
// Set settings file name
controller.settingsPlistName = (UI_USER_INTERFACE_IDIOM() == UIUserInterfaceIdiomPad ?
@"settings_ea_ipad.plist" : @"settings_ea_iphone.plist");
// Set controller object containing chart settings
if (olapReport->chartSettings())
controller.settingsFromReports = (NSDictionary*)olapReport->chartSettings()->nsObject();
// Add controller to array of controllers
[controllers addObject:controller];
// Add controller to pool of objects, for which links are automatically counted
[controller autorelease];
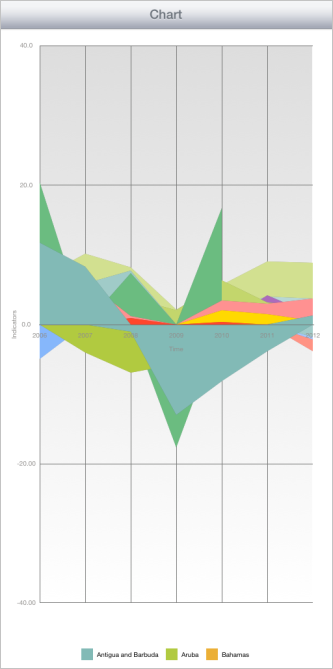
After executing the example the express report is displayed containing the chart, for which a new display value is set, and label font size is changed:

The development environment console displays information about chart properties, name of the file with chart settings, and also name of one of the chart series:
Chart series name for the index 1 in data source: Russia
Whether chart can be zoomed: enabled
Whether chart elements that do not fit are hidden: elements are not hidden
Value of coefficient of the relation between chart area size and size of its elements, at which elements should be hidden: 0
Chart settings file name: settings_ea_ipad.plist
See also: