Operating system requirements: iOS 5.0 or later.
Mobile device: iPad.
This example describes a method of working with chart and axis setup controller. After starting the example the following operations are executed:
A chart and axis setup controller is created.
It is determined whether data should be updated.
Executing the example requires to place the following code in the body of the executeExample method of the ViewController class (see the Displaying of Express Report section):
// Get array of data view controllers
NSArray *controllers =[m_controller dataViewControllers];
// Parse data view controllers in cycle
for(NSObject *controller in controllers)
{
    // Check if the current controller is controller of chart data view
    if([controller isMemberOfClass:[MAChartDataViewController class]])
    {
        // Get chart data view controller object
        MAChartDataViewController *chartController = (MAChartDataViewController *)controller;
        // Create a chart and axis setup controller object
        ChartSettingsViewController *chartSettingsController = [[ChartSettingsViewController alloc] initWithDelegate:chartController];
        // Set whether data should be updated
        [chartSettingsController setNeedUpdate: YES];
        // Display whether data should be updated in the development environmnent console
        NSLog(@"Whether chart data should be updated: %@", [chartSettingsController needUpdate]? @"YES": @"NO");
        // Remove all window subviews
        NSArray *subviews = [self.view subviews];
        for(UIView *subView in subviews)
        {
            [subView removeFromSuperview];
        }
        // Create a navigation controller based on chart and axis setup controller
        UINavigationController *navController = [[[UINavigationController alloc] initWithRootViewController:chartSettingsController] autorelease];
        // Set controller borders
        [[navController view] setFrame:CGRectMake(10, 10, 350, 450)];
        // Display controller view
        [[self view] addSubview:[navController view]];
    }
}
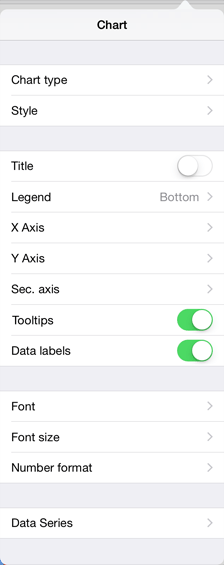
After executing the example the chart and axis setup controller is created:

The development environment console also displays whether data should be updated:
Whether chart data should be updated: YES
See also: