Operating system requirements: iOS 5.0 or later.
Mobile device: iPad.
This example describes some methods of working with a chart data source. After starting the example the following operations are executed:
A chart data source is created and retrieved.
A label of one of chart axes is retrieved by text pattern.
Chart series data is retrieved by specified index.
Data source name is retreived.
The number of series in chart data source is retrieved.
Array of chart data series keys is retrieved.
Array of chart data series titles is retrieved.
Array of timestamps is retrieved.
A new value for chart data transposing indicator is set.
Executing the example requires to place the following code in the body of the executeExample method of the ViewController class (see the Displaying of Express Report section):
// Select chart as the current data view
[m_controller setDataViewControllerWithIndex: 1];
// Get array of data view controllers
NSArray *controllers =[m_controller dataViewControllers];
// Parse data view controllers in cycle
for(NSObject *controller in controllers)
{
    // Check if the current controller is controller of chart data view
    if([controller isMemberOfClass:[MAChartDataViewController class]])
    {
        // Get data view controller object as a chart
        MAChartDataViewController *chartController = (MAChartDataViewController *)controller;
        // Get chart data source
        ChartDataViewDatasource *chart = [[chartController dataSource] datasource];
        // Get axis label by text pattern
        NSString *axisName = [chart axisNameForMask: @"#fixed"];
        // Get series data by specified index
        NSArray *data = [chart seriesDataWithIndex: 1];
        // Get value of the first series element
        double valueOfData = [[data objectAtIndex:0] doubleValue];
        // Data source name
        NSString *cubeName = [chart cubeName];
        // Get the number of series in chart data source
        int seriesCount = [chart seriesCount];
        // Get array of data series keys
        NSArray *seriesKeys = [chart seriesKeys];
        // Get value of the first key in array
        int valueOfSeriesKeys = [[seriesKeys objectAtIndex:0] longValue];
        // Get array of series titles
        NSArray *seriesTitles = [chart seriesTitles];
        // Get array of timestamps
        NSArray *timestamps = [chart timestamps];
        // Get array of timestamp labels
        NSArray *timestampTitles = [chart timestampTitles];
        // Display obtained information in the development environment console
        NSLog(@"Label for fixed dimension: %@", axisName);
        NSLog(@"Value of the first series element with the 1 index: %f", valueOfData);
        NSLog(@"Data source name: %@", cubeName);
        NSLog(@"Number of series in chart data source: %d", seriesCount);
        NSLog(@"value of the first key in array of data series keys: %d", valueOfSeriesKeys);
        NSLog(@"First title in array of series titles: %@", [seriesTitles objectAtIndex: 0]);
        NSLog(@"First timestamp - value: %@, label: %@",[timestamps objectAtIndex:0], [timestampTitles objectAtIndex:0]);
        break;
    }
}
It is also required to replace the code in the static example file MAExpressAnalysisReportViewControllerDelegateImpl.mm in the initWithOlapReport: method in the block:
if (self.isChartEnabled)
with the following code:
// Check if pivot object for building data table is empty
if (m_gridPivot == NULL)
{
    // Get report settings
    SNDictionary gridOlapPlist = m_olapReport->storageDictionary()->objectForKey<NDictionary>(GRID_OLAP_KEY);
    // Create a report
    SPPLOlapReport gridOlapReport = NULL;
    if (gridOlapPlist != NULL)
    {
        gridOlapReport = PPLOlapReport::olapReport(m_olapReport->descriptor(), gridOlapPlist);
    }
    // Create a pivot object for building data table
    m_gridPivot = (gridOlapReport != NULL) ? PPLPivot::pivot(gridOlapReport) : PPLPivot::pivot(m_olapReport);
    // Create a data table
    m_gridPivotTable = PPLPivotTable::pivotTable(m_gridPivot);
    // Get data table settings
    SNDictionary gridPivotTablePlist = m_olapReport->storageDictionary()->objectForKey<NDictionary>(GRID_PIVOT_TABLE_KEY);
    // Check if table settings object is empty
    if (gridPivotTablePlist != NULL)
    {
        // Set table settings
        m_gridPivotTable->setupFromPlist(gridPivotTablePlist);
    }
    else
    {
        // Apply table settings
        [self applyGridSettings];
    }
}
// Create a data source based on data table
m_chartDatasource = [[ChartDataViewDatasource alloc] initWithPivotTable:m_gridPivotTable];
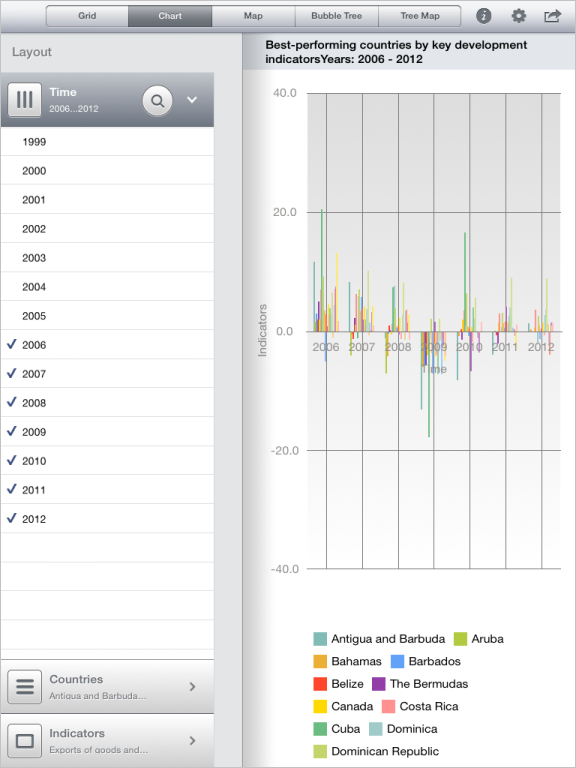
After executing the example the express report is displayed containing a chart based on the created data source:
The development environment console also displays information about chart data source:
Fixed dimension label: Indicators
Value of the first element with the 1 index: 12625.619629
Data source name: World Development Indicators
Number of series in chart data source: 2
Value of the first key in the array of data series keys: 44
The first title in the array of series titles: China
The first timestamp - value: 0, label: 1990
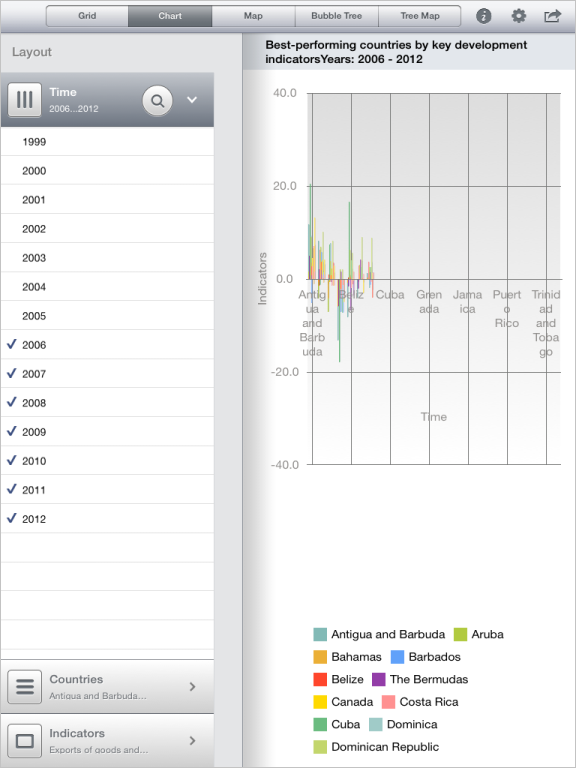
Then add the following code in the executeExample method of the ViewController class before the break operator:
// Determine whether source data is transposed
[chart setTransporateData:NO];
// Refresh chart data
[chart updateData];
After executing the updated example the express report is displayed containing a chart based on the transposed data source:
See also: