Operating system requirements: iOS 5.0 or later.
Mobile device: iPad.
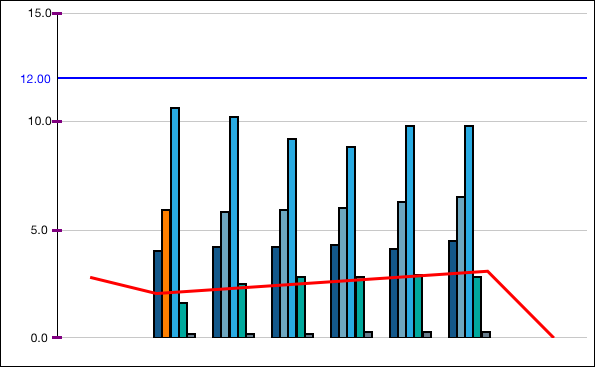
This example implements changing of chart series point color, resizing, changing of color, thickness and chart axis marker alignment. It also implements hiding of X axis and setting of value axis offset.
Executing the example requires to place the following code instead of the executeExample method of the ViewController class (see the Creating of Level Lines and Trend on Chart section):
// Function for example execution
-(void) executeExample{
     // Get chart series
    ColumnSeries *chartSerie = [chart seriesList][1];
    // Get chart series point
    ColumnPoint *columnPoint = [[chartSerie points] objectForKey:[NSNumber numberWithInt:0]];
    // Set chart series background color
    [columnPoint setBackground:[SolidColorBrush solidColorBrushWithColor:[UIColor orangeColor]]];
    // Get chart X axis
    ValueAxis *xAxis = [chart xAxis];
    // Initialize axis
    [xAxis initWithFrame:CGRectMake(0, 0, 600, 550) type: AxisLineX];
    // Get chart Y axis
    ValueAxis *yAxis = [chart yAxis];
    // Get markers
    AxisTicks *yMajAxisTicks = [yAxis majorTicks];
    // Set marker size
    [yMajAxisTicks setSize:5];
    // Set marker color
    [yMajAxisTicks setColor:[UIColor purpleColor]];
    // Set marker thickness
    [yMajAxisTicks setThickness: 3];
    // Set marker alignment
    [yAxis setTickLabelAlignment:AlignmentRight];
    // Hide X axis
    [xAxis setOptimizedOut:YES];
    // Set value axis offset
    [chart setAxisOffset:-2];
}
As a result, chart series point color, axis marker parameters are changed. The X axis is hidden, value axis offset is set:

See also: