Operating system requirements: iOS 5.0 or later.
Mobile device: iPad.
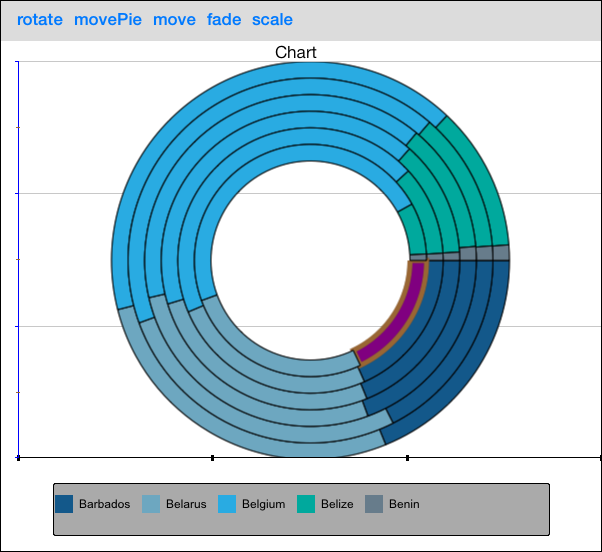
This example implements changing of series point border color and thickness, changing of pie chart series point background. The example also displays hiding of chart axis labels.
Executing the example requires to place the following code in the body of the executeExample method of the ViewController class (see the Chart Animation section):
// Get pie chart series
PieSeries *pieSeries = [chart seriesList][0];
// Get pie chart series point
PiePoint *piePoint = [[pieSeries points] objectForKey:[NSNumber numberWithInt:0]];
// Set series point border color
[piePoint setBorderColor:[UIColor brownColor]];
// Set series point border thickness
[piePoint setBorderThickness:5];
// Determine brush
SolidColorBrush *brush = [SolidColorBrush solidColorBrushWithColor:[UIColor purpleColor]];
// Set series point background
[piePoint setBackground:brush];
// Get X axis of chart
ValueAxis *xAxis = [chart xAxis];
// Get Y axis of chart
ValueAxis *yAxis = [chart yAxis];
// Hide chart axis labels
[xAxis setLabelsOptimizedOut:YES];
[yAxis setLabelsOptimizedOut:YES];
After executing the example pie chart series point parameters are changed, and also chart axis labels are hidden:

See also: