Operating system requirements: iOS 5.0 or later.
Mobile device: iPad.
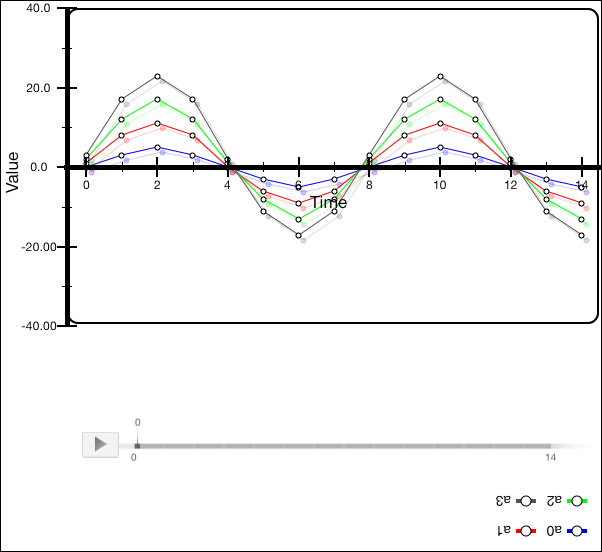
This example implements changing of color, width and rounding radius of chart borders, and also the following chart legebd properties:
Legend contents orientation.
Maximum legend height and width values.
Maximum number of legend columns.
The arrangement by maximum number of columns, additional contents above and below legend indicators are also set. The development environment console displays the calculated and actual values of legend contents area size. On starting of clicking the chart area the legend contents is cleared, on ending of clicking the chart area the contents is restored.
Executing the example requires to place the following code instead of the executeExample class of the ViewController method (see the Creating a Line Chart section):
// Function for example execution
-(void) executeExample{
    // Set chart border color
    [[chart border] setBorderColor:[UIColor blackColor]];
    // Set chart border width
    [[chart border] setBorderThickness:2];
    // Set chart border rounding radius
    [[chart border] setBorderRadius:10];
    // Set legend contents rotation angle
    [[chart legend]setContentRotation:LegendContentRotation180deg];
    // Set maximum value of legend height
    [[chart legend] setMaxHeight:70];
    // Set legend width value
    [[chart legend] setLegendWidth:120];
    // Set maximum number of columns
    [[chart legend] setMaximumColumnCount:2];
    // Order by maximum number of columns
    [[chart legend] setOrderByColumn:YES];
    // Set additional contents above legend indicators
    [[chart legend] setMoreContentAboveIndicator:[UIImage imageNamed:@"circle.png"]];
    // Set additional contents above legend indicators
    [[chart legend] setMoreContentBelowIndicator:[UIImage imageNamed:@"circle.png"]];
    // Calculate and display legend size according to the specified area
    CGSize contentSize =[[chart legend] contentSizeForRect:CGRectMake(0, 0, 200, 200)];
    NSLog(@"%@ (%f, %f)", @"Calculated chart legend contents area size:",
          contentSize.width, contentSize.height);
};
// Handle chart touch start event
- (void)chartTouchesBegan:(NSSet *)touches withEvent:(UIEvent *)event sender:(id)sender{
    // Clear legend contents
    [[chart legend] clearLegend];
}
// Handle chart area touch event
- (void)chartTouchesTapInView:(UIView *)v withPoint:(CGPoint)point
{
    // Set legend contents based on chart data
    [[chart legend] fillLegend];
    // Display legend contents area size
    CGSize lSize = [[chart legend] contentSize];
    NSLog(@"%@ (%f, %f)", @"Legend contents area size:", lSize.width, lSize.height);
    // Determine the object containing legend parameters
    NSMutableDictionary *newValuesDict = [NSMutableDictionary dictionaryWithObjectsAndKeys:
                                          [UIFont fontWithName:@"Arial" size: 20], @"m_font",
                                          [UIColor blueColor], @"m_textColor",
                                          nil];
    // Determine the object containing default legend parameters
    NSMutableDictionary *defaultValuesDict = [NSMutableDictionary dictionaryWithObjectsAndKeys:
                                              [UIFont fontWithName:@"Arial" size: 14], @"m_font",
                                              [UIColor blackColor], @"m_textColor",
                                              nil];
    // Set legend parameters
    [[chart legend] configureLegendWithDict:newValuesDict andDefaults:defaultValuesDict];
}
After executing the example, chart legend and border parameters are changed:

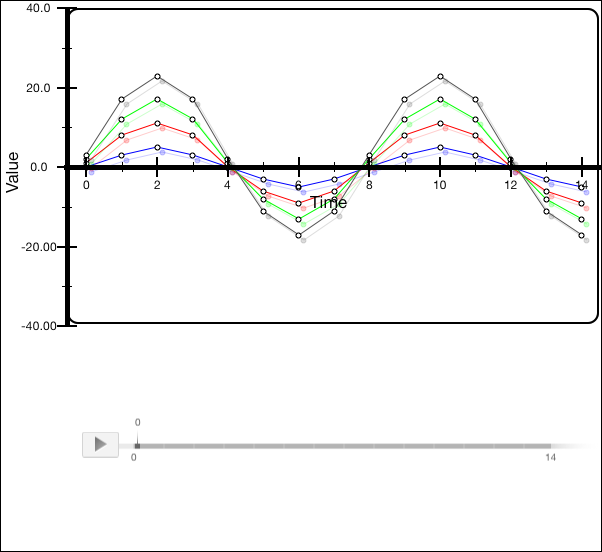
On starting of clicking the chart area the legend contents is cleared:

On ending of clicking the chart area the contents is restored.
The development environment console displays the calculated and actual legend area size:
Calculated legend area size: (120.000000, 74.000000)
Legend contents area size: (120.000000, 74.000000)
On legend scrolling, additional contents below and above the indicators is also displayed:

See also: