Operating system requirements: iOS 5.0 or later.
Mobile device: iPad.
This example implements adding of level line to chart. On changing timeline value and clicking the chart area the following actions occur:
Level line value is changed.
Timeline value is reset.
Marker of obtained data series point is resized.
Chart legend drawing area is changed.
After repeated click on the chart area, the legend closes.
The environment console also displays the following information:
New values of timeline.
New value of chart level line.
Actual size of chart legend area.
Size of additional legend margins determined automatically.
Executing the example requires to place the following code instead of the executeExample class of the ViewController method (see the Creating a Line Chart section):
// Function for example execution
-(void) executeExample{
    // Determine and set the object used for timeline indexes
    TimeIndexDelegate *timeIndexDelegate = [TimeIndexDelegate new];
    [chart setTimeIndexDelegate:timeIndexDelegate];
    // Determine the object used to work with level line
    LevelLineHolderDelegate *levelLineHolderDelegate = [LevelLineHolderDelegate new];
    // Determine level line
    LevelLineHolder *line = [[LevelLineHolder new] autorelease];
    [line setIsHorisontal:YES]; // Line position
    [line setDelegate:levelLineHolderDelegate];
    [line setColor:[UIColor blueColor]]; // Line color
    [line setThickness:5]; // Line thickness
    [line setValue:2]; // Level line value
    [line setVisible:YES]; // Indicates whether line is visible
    [line setName:@"Level line"]; // Line name
    [line setLabelVisible:YES]; // Indicates whether line label is visible
    [line setChartView:chart]; // Chart, to which line belongs
    // Add line to chart
    [chart addLevelLine:line];
};
// process chart area touch event
- (void)chartTouchesTapInView:(UIView *)v withPoint:(CGPoint)point{
    // Get level line
    LevelLineHolder *line = [chart levelLines][0];
    // Get chart legend
    ChartLegend *legend = [chart legend];
    ChartPlaced *pl = [[ChartPlaced new] autorelease];
    // Set margins
    Thickness t;
    t.top = 200;
    t.right = 30;
    [legend setAutoMargin:t];
    if([[chart timeAxis] index] != 0)
    {
        // Set chart legend drawing area
        [legend setFrameForChartPlaced:legend];
    }
    else{
        // Hide chart legend
        [legend setOptimizedOut:YES];
        return;
    }
    // Initialize level line value change event
    [[line delegate] levelLineHolderValueChanged:[[chart timeAxis] index]];
    // Set level line value
    [line setValue:[[chart timeAxis] index]];
    // Display actual size of legend area
    CGRect bounds = [legend boundsWithPadding];
    NSLog(@"%@ (%f, %f)", @"Actual size of legend area:", bounds.size.width,bounds.size.height);
    // Display value of legend additional padding size
    NSLog(@"%@ %f", @"Size of legend additional paddings:", [legend autoPadding]);
    //Display value of additional legend margin size
    NSLog(@"%@ %f", @"Size of additional legend margins:", [legend autoMargin]);
    // Get data series point by specified coordinates
    LinePoint *chartPoint = [[chart chartArea] findChartPointHit:CGPointMake(405, 152)];
    // Resize data series point marker
    [chartPoint setMarkerSize:20];
    // Reset timeline value
    [[chart timeAxis] reset];
}
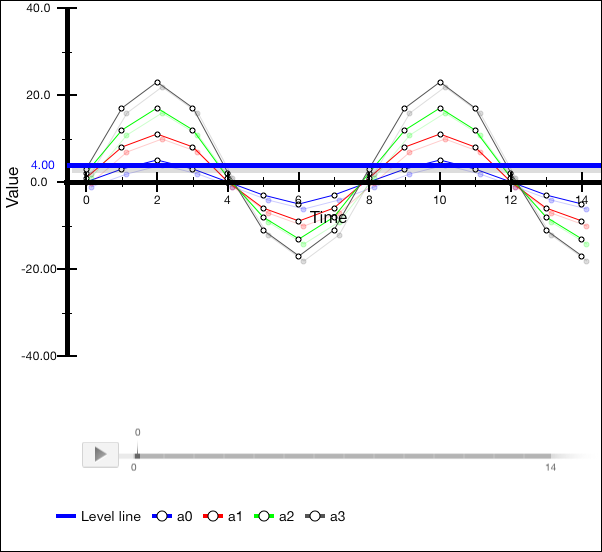
After executing the example a level line is added:

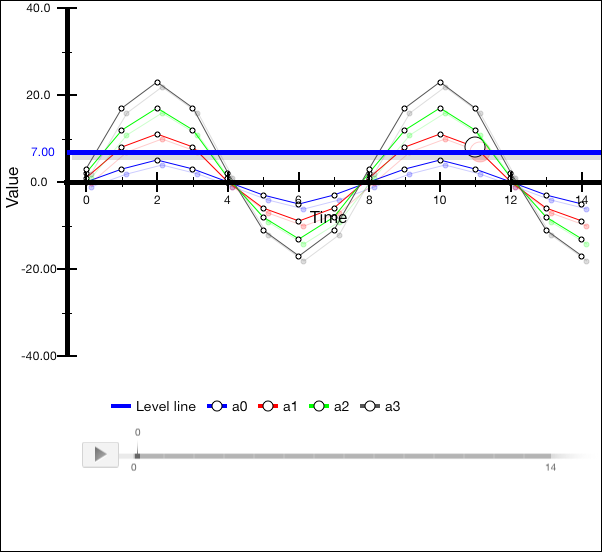
Set timeline to any value that is different from 0, click the chart area.
As a result, level line value is changed, the chart legend is displayed in other area, data series point marker is resized, the timeline value is reset:

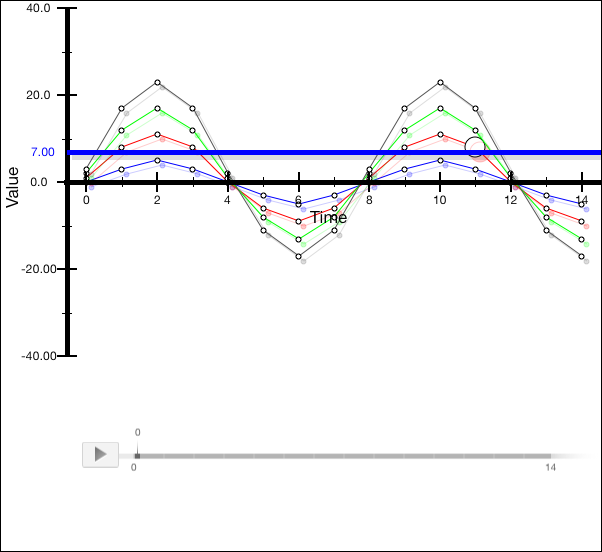
Click the chart area.
As a result, the chart legend is hidden:

The development environment console also displays information about new values of timeline and level line, and also information about the chart legend:
Timeline index is changed, new index value: 7
Level line value is changed, new value: 7.000000
Actual size of legend area: (600.000000, 450.000000)
Size of additional legend paddings: 0.000000
Size of additional legend margins: 0.000000
Timeline index is changed, new value: 0
See also: