Spectrum analysis is a method of data treatment related to transformation of data frequency or spectrum. The spectrum is a result of decomposing the source function that depends on time (time series) or space coordinates to the basis of a periodic function. Most often the spectrum analysis uses the Fourier spectrum obtained from sine base (Fourier transform).
In the Fourier transform, the initial non-periodic random-form function that cannot be described analytically, is represented as a collection of sine or cosine functions with various frequency and amplitude. In other words, a complex function is transformed to a set of simple functions. Each sinusoid or cosinusoid with certain frequency and amplitude obtained as a result of the Fourier transform is named a spectral component or harmonic. Spectral components form the Fourier spectrum.
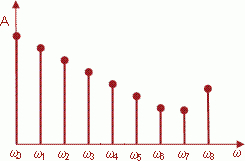
Graphically, the Fourier spectrum is shown as a graph with circular frequency ω along the horizontal axis, and the amplitude of spectral components, commonly denoted as A shown along the vertical axis. Then each spectral component can be represented as a count, which horizontal position corresponds to its frequency, and vertical position corresponds to its amplitude. A harmonic with zero frequency is named the constant component (a straight line in time representation).

Visual spectrum analysis can give some information on the character of the function, on which it is based. Quick changes in the original data create high-frequency spectrum components, while slow changes create low-frequency components. If the amplitude of the components quickly decreases with the increase of frequency, the original function (for example, a time series) is smooth. If the spectrum includes high-frequency components with a large amplitude, the original function contains sharp fluctuations. Thus, for a time series this may mean that the random component is large, or the processes described by the time series are unstable, or the data contains noise.
The spectral processing is based on manipulations with the spectrum. If the amplitude of high-frequency components is reduced (attenuated), and then the original function is restored based on the altered spectrum by applying the inverse Fourier transform, the function becomes smoother due to removal of the high-frequency component. For example, for a time series this means removing information about daily sales volume that are greatly influenced by random factors, and considering more stable trends such as seasonality. On the other hand, it is possible to attenuate only low-frequency components, which enables the user to remove slow changes and consider only quick ones. In case of a time series this means attenuating of the seasonal component.
Using the spectrum in such a way, one may get required changes in the original data. Most frequently time series are smoothed by removing high-frequency components of the spectrum or by reducing their amplitude.
Manipulations with spectrum require filters, that is, the algorithms that can control spectrum shape, suppress or enhance its components. The main property of each filter is its frequency response function, the form of which influences the spectrum transformation. If the filter attenuates only low-frequency components, it is called a low-cut filter (LCF), and it can be used to smooth data, and clear it form the noise and abnormal values. If the filter attenuates only high-frequency components, it is called the high-cut filter (HCF). This filter can be used to attenuate slow changes, for example, data series seasonality. Many other filter types are used: band-pass filters, band-rejection filters, and so on. Selecting type and form of the filter's frequency characteristics, it is possible to convert the source data as required, by spectral processing.
It is important to select correct filter passband when filtering data to smooth it and to remove noise. If the passband is too wide, the smoothing is insufficient, and the noise is not fully suppressed. If the passband is too narrow, the filter may attenuate both the noise and the changes that carry some useful information. While the technical applications include strict criteria that define optimal filter characteristics, analytical technologies mostly use experimental methods.
Spectrum analysis is one of the most effective and well developed methods of data treatment. Frequency filtering is only one field of its applications. Spectrum analysis is also used in correlation and statistical analysis, for signal and function synthesis, model plotting, and so on.
See also:
Library of Methods and Models | IEmUnivariateSpectrumAnalysisSettings | ISmUnivariateSpectrumAnalysis