The example shows changing of Y axis values format depending on the data in the selected express report table area or time series database workbook area. Such change enables the user to get actual range even if rather small (10-10) or quite large values were used on plotting a chart.
Executing the example requires a form containing the LanerBox component with the LanerBox1 identifier, the LanerResultBox component with the LanerResultBox1 identifier and the UiErAnalyzer component with the UiErAnalyzer1 identifier that is a data source for the LanerBox1 and LanerResultBox1 components. Specify a time series database workbook as a data source for the UiErAnalyzer1 component.
The example is a handler of the OnChartChanged event for the LanerResultsBox1 component.
Sub LanerResultsBox1OnChartChanged(Sender: Object; Args: ILanerResultsBoxChartChangedEventArgs);
Begin
text := text + "1";
End Sub LanerResultsBox1OnChartChanged;
On selecting a data area in the LanerBox1 component the chart and Yaxis values format are changed.
In order the chart is plot by all table data, select the entire data area or put the mouse cursor to one of the following positions:
The table corner (a top left table cell that contains no data).
Any cell of data area.
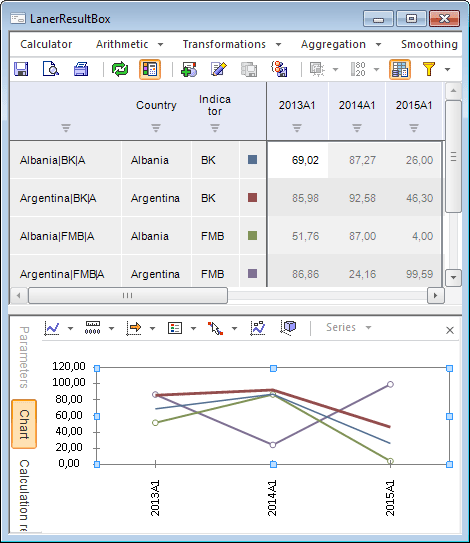
The LanerResultBox1 component will display the chart plot by the entire data area:

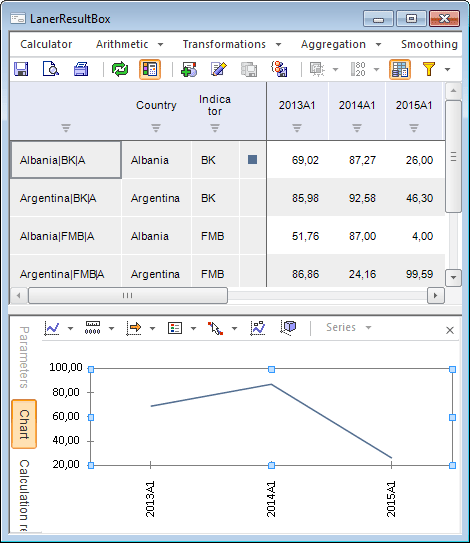
If the cursor is put on the series name, its characteristics or if a particular series is selected, the form looks as follows:

As a result the LanerResultBox1 component shows a chart for a particular data series. The scale of values is refreshed.
See also: