 Example code
DimCalculateStyle(DimKey: Integer; CalculatedElement: Integer): ITabCellStyle;
DimKey. The dimension key with calculated factors.
CalculatedElement. Unique identifier of calculated factor.
The DimCalculateStyle property determines style of the cells containing calculated factors.
Unique identifier of calculated factor is obtained in the property IPivotEvaluatorDimCalculatesItem.CalculatedElement.
Executing the example requires a form with the Button1 button, the UiErAnalyzer component named UiErAnalyzer1 and the TabSheetBox component used to display data.

Sub Button1OnClick(Sender: Object; Args: IMouseEventArgs);
Var
OLAP: IEaxAnalyzer;
Grid: IEaxGrid;
Pivot: IPivot;
Sel: IDimSelection;
Totals: IPivotEvaluatorTotals;
Dim: IDimInstance;
Calcs: IPivotEvaluatorDimCalculates;
Calc: IPivotEvaluatorDimCalculatesItem;
TStyle: IEaxTableStyle;
CellStyle, HeaderStyle: ITabCellStyle;
i, i1: Integer;
Begin
OLAP := UiErAnalyzer1.Instance As IEaxAnalyzer;
Grid := OLAP.Grid;
Pivot := OLAP.Pivot;
//Totals
Totals := Pivot.Evaluator.Totals;
Totals.RowTypes := PivotEvaluatorElementType.Sum;
//Calculated factor - Percentage of total
Dim := Pivot.TopHeader.Dim(0);
Calcs := Pivot.Evaluator.DimCalculates;
Calc := Calcs.FindByDimKey(Dim.Key);
Sel := Pivot.Selection.FindByKey(Dim.Key);
i := Calc.AddPercentCalculate("Percentage of total", Sel.Element(0), DimRelation.Last, PivotEvaluatorTotalDisposition.Overall, PivotEvaluatorElementType.Sum);
i1 := Calc.AddPercentCalculate("Percentage of subtotal", Sel.Element(0), DimRelation.Last, PivotEvaluatorTotalDisposition.Sub_, PivotEvaluatorElementType.Sum);
//Formatting style for calculated factors
CellStyle := New TabCellStyle.Create;
CellStyle.BackgroundColor := GxColor.FromName("Coral");
CellStyle.Font.Bold := TriState.OnOption;
CellStyle.CustomFormat := "0,00%";
//Formatting style for calculated factors headers
HeaderStyle := New TabCellStyle.Create;
HeaderStyle.BackgroundColor := GxColor.FromName("Red");
//Set styles
TStyle := Grid.Style;
TStyle.DimCalculateStyle(Dim.Key, Calc.CalculatedElement(i)) := CellStyle;
TStyle.DimCalculateStyle(Dim.Key, Calc.CalculatedElement(i1)) := CellStyle;
TStyle.DimCalculateHeaderStyle(Dim.Key, Calc.CalculatedElement(i)) := HeaderStyle;
TStyle.DimCalculateHeaderStyle(Dim.Key, Calc.CalculatedElement(i1)) := HeaderStyle;
Grid.Refresh;
End Sub Button1OnClick;
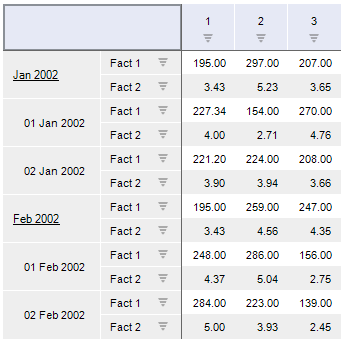
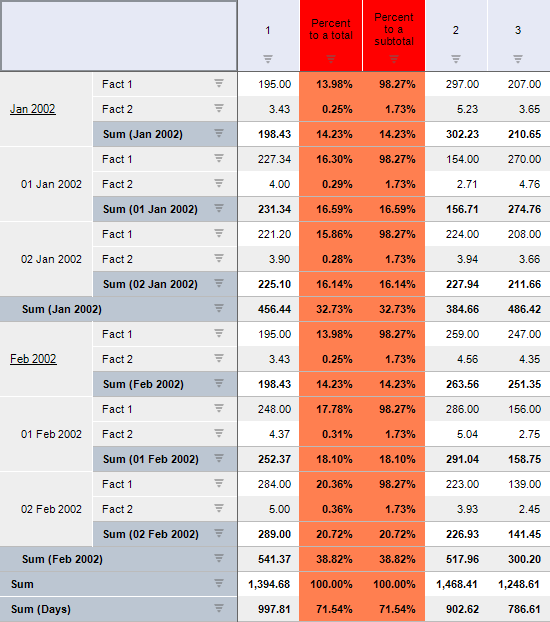
The totals counting is enabled, when clicking the button for express report, loaded to UiErAnalyzer1. Values sum is calculated by rows. Subtotals values are also to be calculated. The system will create two calculated factors that perform calculations on the basis of the first column values. The first calculated factor calculates percentage of values to general totals, the second one calculates percentage of intermediate totals. Display format is set for calculated factors.

Executing the example requires a .NET form with the Button1 button, the UiErAnalyzerNet component named UiErAnalyzerNet1 and the TabSheetBoxNet component used to display data.

Imports Prognoz.Platform.Forms.Net;
Imports Prognoz.Platform.Interop.Dimensions;
Imports Prognoz.Platform.Interop.Drawing;
Imports Prognoz.Platform.Interop.Express;
Imports Prognoz.Platform.Interop.ForeSystem;
Imports Prognoz.Platform.Interop.Pivot;
Imports Prognoz.Platform.Interop.Tab;
Private Sub button1_Click(sender: System.Object; e: System.EventArgs);
Var
OLAP: IEaxAnalyzer;
Grid: IEaxGrid;
Pivot: IPivot;
Sel: IDimSelection;
Totals: IPivotEvaluatorTotals;
Dim: IDimInstance;
Calcs: IPivotEvaluatorDimCalculates;
Calc: IPivotEvaluatorDimCalculatesItem;
TStyle: IEaxTableStyle;
CellStyle, HeaderStyle: TabCellStyle;
GxColorCls: GxColorClassClass = New GxColorClassClass();
i, i1: Integer;
Begin
OLAP := UiErAnalyzerNet1.AnalyzerUi.Instance As IEaxAnalyzer;
Grid := OLAP.Grid;
Pivot := OLAP.Pivot;
//Totals
Totals := Pivot.Evaluator.Totals;
Totals.RowTypes := Convert.ToInt32(PivotEvaluatorElementType.peetSum);
//Calculated factor - Percentage of total
Dim := Pivot.TopHeader.Dim[0];
Calcs := Pivot.Evaluator.DimCalculates;
Calc := Calcs.FindByDimKey(Dim.Key);
Sel := Pivot.Selection.FindByKey(Dim.Key);
i := Calc.AddPercentCalculate("Percentage of total", Sel.Element[0], DimRelation.drLast, PivotEvaluatorTotalDisposition.petdOverall, PivotEvaluatorElementType.peetSum);
i1 := Calc.AddPercentCalculate("Percentage of subtotal", Sel.Element[0], DimRelation.drLast, PivotEvaluatorTotalDisposition.petdSub, PivotEvaluatorElementType.peetSum);
//Formatting style for calculated factors
CellStyle := New TabCellStyleClass();
CellStyle.BackgroundColor := GxColorCls.FromName("Coral");
CellStyle.Font.Bold := TriState.tsOnOption;
CellStyle.CustomFormat := "0,00%";
//Formatting style for calculated factors' headers
HeaderStyle := New TabCellStyleClass();
HeaderStyle.BackgroundColor := GxColorCls.FromName("Red");
//Set styles
TStyle := Grid.Style;
TStyle.DimCalculateStyle[Dim.Key, Calc.CalculatedElement[i]] := CellStyle;
TStyle.DimCalculateStyle[Dim.Key, Calc.CalculatedElement[i1]] := CellStyle;
TStyle.DimCalculateHeaderStyle[Dim.Key, Calc.CalculatedElement[i]] := HeaderStyle;
TStyle.DimCalculateHeaderStyle[Dim.Key, Calc.CalculatedElement[i1]] := HeaderStyle;
Grid.Refresh();
End Sub;
After executing the example, clicking the button starts calculating totals for the express report loaded to "UiErAnalyzer1". Values sum is calculated by rows. Subtotals values are also to be calculated. The system will create two calculated factors that perform calculations on the basis of the first column values. The first calculated factor calculates percentage of values to general totals, the second one calculates percentage of intermediate totals. Display format is set for calculated factors.

See also: