To execute the example, create an HTML page and perform the following operations:
1. Add a link to the PP.css and PP.DataGrid.css. files. Also add links to the following JS files:
PP.js;
PP.DataGrid.js.
2. In the <body> tag place a block with the dataGrid identifier and add a link to the script for creating an asynchronous data table:
<body>
    <div id="dataGrid"></div>
    <script src="asynchDataSource.js" type="text/javascript"></script>
</body>
3. Create the asynchDataSource.js script file:
(function () {
    // Creates a data source
    function createDataSource() {
        var dataSource = new PP.Ui.DGDataSource();
        // Add event handlers for table data source
        initDataSourceEvents(dataSource);
        return dataSource;
    }
    // Adds event handlers for table data source
    function initDataSourceEvents(dataSource) {
        dataSource.MeasuresLoaded.add(onMeasuresLoaded, this);
        dataSource.RangesLoaded.add(onRangesLoaded, this);
    }
    // Processes the MeasuresLoaded event
    function onMeasuresLoaded(sender, args) {
        console.log("Dimensions are loaded to table");
    }
    // Processes the RangesLoaded event
    function onRangesLoaded(sender, args) {
        console.log("Data is loaded to table");
    }
    // Creates a data table
    createComponent = function() {
        var grid = new PP.Ui.DataGrid({
            BackgroundCSS: "#DDDDDD", // Fill color
            DataSource: createDataSource(),
            Height: 150,
            ImagePath: "../../build/img/",
            NearLimit: 1, // Load data if the last row is not yet watched
            ParentNode: document.getElementById('dataGrid'),
            RowsToBuffer: 5, // Load by 5 rows
            ScrollType: PP.Ui.DataGridScrollType.ByRow,
            Width: 300
        });
        return grid;
    }
    // Create a data table
    grid = createComponent();
    // Loads data to table asynchronously
    function loadAsyncData(grid) {
        var dataSource = grid.getDataSource();
        dataSource.setType(PP.Ajax.Type.GET);
        dataSource.setIsAsync(True);
        dataSource.setUrl("dataSource.js");
        dataSource.loadMeasures({ sortInfo: grid.getSortInfo() });
    }
    // Displays information about data table
    function printDataGridInfo(grid) {
        console.log("Information about table:");
        console.log("Number of rows in table: %s", grid.getDataSource().getRowCount());
        console.log("Default row height: %s", grid.getDataSource().getDefaultRowHeight());
        console.log("Sum of heights of all table rows: %s", grid.getVisibleRowsHeight());
    }
    // Load data asynchronously
    loadAsyncData(grid);
    // Display information about data table
    setTimeout(function() {
        printDataGridInfo(grid);
    }, 1000);
})();
4. Create the dataSource.js script file that contains data for table:
{
    "@Version": 1,
    "Structure": {
        "@FH": False,
        "@DRB": True,
        "DefaultRow": {
            "@H": 20
        },
        "DefaultColumn": {
            "@W": 70,
            "@H": 40
        },
        "Rows": {
            "Row": []
        },
        "Columns": {
           "Column": [{
               "Title": "№",
               "Width": "20",
               "IsVisible": True,
               "IsBand": False,
               "Enabled": True,
               "EnableColumnResize": True,
               "EnableColumnMove": True,
               "EnableSort": True,
               "Name": "num",
               "StyleIndex": 2,
               "CellType": "num",
               "RenderEditor": False
           }, {
               "Title": "Country",
               "Width": "80",
               "IsVisible": True,
               "IsBand": False,
               "Enabled": True,
               "EnableColumnResize": True,
               "EnableColumnMove": True,
               "EnableSort": True,
               "Name": "country",
               "StyleIndex": 2,
               "CellType": "string"
           }, {
               "Title": "Population, mln people",
               "Width": "80",
               "IsVisible": True,
               "IsBand": False,
               "Enabled": False,
               "EnableColumnResize": True,
               "EnableColumnMove": True,
               "EnableSort": True,
               "Name": "popul",
               "Editor": {
                   "PPType": "PP.Ui.NumberEdit",
                   "MaxValue": 1000,
                   "MinValue": 0
               },
               "StyleIndex": 2,
               "CellType": "num"
           }, {
               "Title": "Identifier",
               "Width": "90",
               "IsVisible": True,
               "AutoSize": False,
               "IsBand": False,
               "Enabled": True,
               "EnableColumnResize": True,
               "EnableColumnMove": True,
               "EnableSort": True,
               "Name": "id",
               "StyleIndex": 2,
               "RenderEditor": False,
               "CellType": "string"
           }]
       }
    },
    "Styles": {
        "Style": [{
            "@B": "",
            "Text": {
                "@VA": "1",
                "@HA": "2",
                "@M": "0 0 0 0",
                "@WW": "1"
            },
            "Fill": {
                "@C": "#FFEF99"
            },
            "Font": {
                "@A": "0",
                "@B": "False",
                "@S": "12",
                "@C": "#666666",
                "@F": "Tahoma"
            },
            "Borders": {
                "Border": [{
                    "@S": "7",
                    "@C": "#FF9384",
                    "@W": "1",
                    "@I": "0"
                }, {
                    "@S": "7",
                    "@C": "#FF9384",
                    "@W": "1",
                    "@I": "1"
                }, {
                    "@S": "7",
                    "@C": "#FF9384",
                    "@W": "1",
                    "@I": "2"
                }, {
                    "@S": "7",
                    "@C": "#FF9384",
                    "@W": "1",
                    "@I": "3"
                }, {
                    "@S": "7",
                    "@C": "#FF9384",
                    "@W": "1",
                    "@I": "4"
                }, {
                    "@S": "7",
                    "@C": "#FF9384",
                    "@W": "1",
                    "@I": "5"
                }
                ]
            }
        }]
    },
    "TotalRowCount": 2,
    "Rows": {
        "Row": [{
            "@I": 0,
            "Cells": {
                "num": {
                    "@SI": "2",
                    "CellData": {
                        "@V": 0,
                        "@FT": 0
                    }
                },
                "country": {
                    "@SI": "2",
                    "CellData": {
                        "@V": "Russia",
                        "@FT": "Russia"
                    }
                },
                "popul": {
                    "@SI": "2",
                    "CellData": {
                        "@V": 143,
                        "@FT": 143
                    }
                },
                "id": {
                    "@SI": "0",
                    "CellData": {
                        "@V": "ru",
                        "@FT": "ru"
                    }
                }
            }
        }, {
          "@I": 1,
          "Cells": {
              "num": {
                    "@SI": "2",
                    "CellData": {
                        "@V": 1,
                        "@FT": 1
                    }
                },
                "country": {
                    "@SI": "2",
                    "CellData": {
                        "@V": "France",
                        "@FT": "France"
                    }
                },
                "popul": {
                    "@SI": "2",
                    "CellData": {
                        "@V": 65,
                        "@FT": 65
                    }
                },
                "id": {
                    "@SI": "0",
                    "CellData": {
                        "@V": "fr",
                        "@FT": "fr"
                    }
                }
            }
        }]
    }
}
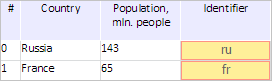
After executing the example a table with asynchronously loaded data is placed to the HTML page:
The browser console displays information about the created table and messages that dimensions and data are loaded to the table:
Dimensions are loaded to table
Data is loaded to table
Information about table:
Number of table rows: 2
Default row height: 20
Sum of heights of all table rows: 40
See also: