getValuePoint(value: Number);
The getValuePoint returns a point that contains cylinder axis value.
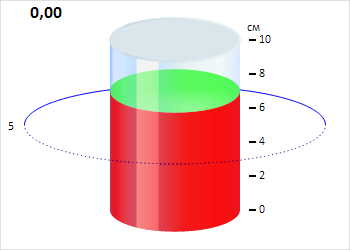
To execute the example, the HTML page must contain the Cylinder component named cylinder (see Example of Creating the Cylinder Component). Change cylinder axis look:
// Determine axis values
var values = ["0", "2", "4", "6", "8", "10"];
// Get cylinder axis
var axis = cylinder.getAxis();
// Add axis tick mark labels
for (var i in values) {
    var label = new PP.Ui.ChartSVGLabel({
        ParentNode: axis.getDomNode(), // Parent DOM node
        Text: values[i], // Label text
        Left: axis.getValuePoint(values[i]).getX() + 15, // Left border indent
        Top: axis.getValuePoint(values[i]).getY() - 9 // Top border indent
    });
    // Render label
    label.draw();
}
// Remove old axis labels
for (var i in axis.getLabelset()) {
    var label = axis.getLabelset()[i];
    label.dispose();
}
// Remove major axis tick marks
for (var i in axis.getMajorTicks()) {
    var tick = axis.getMajorTicks()[i];
    tick.clear();
    tick = new PP.Ui.AxisTick({
        ParentAxis: axis
    });
    tick.setPosition(new PP.Point({
        X: axis.getValuePoint(values[i]).getX() + 5,
        Y: axis.getValuePoint(values[i]).getY()
        })
    );
    tick.setTickStyle({
        Border: new PP.Border({
            Width: 2, // Tick mark width
        }),
        Length: 7
    });
    tick.redraw();
}
// Remove minor axis tick marks
for (var i in axis.getMinorTicks()) {
    var tick = axis.getMinorTicks()[i];
    tick.clear();
}
After executing the example cylinder axis look is changed:
See also: