PP.Ui.GaugeTrendPoint (settings);
settings. JSON object that contains values of component properties.
The GaugeTrendPoint constructor creates an instance of the GaugeTrendPoint class.
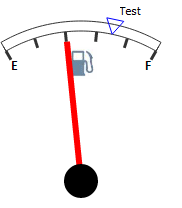
To execute the example, the page must contain the Speedometer component named speed1 (see Example of Creating a Fuel Gauge Unit). Add a button to the page, clicking which creates a mark in the speedometer scale:
<input TYPE="button" VALUE="GaugeTrendPoint" ONCLICK="GaugeTrendPoint()">
<script>
function GaugeTrendPoint()
{
	var trend = new PP.Ui.GaugeTrendPoint({
		Value: 35,//value where a mark is placed
		Label:{Text: "Test"},//mark label text
		Marker:
		{
			PPType: PP.Ui.TriangleMarker,//marker used to show a mark
			Size: 20,
			Flip: true,
			Border: { PPType: PP.SolidColorBrush, Color: "blue" },
		}
	});
	speed1.getScales(1).getTrends().push(trend);
	speed1.getScales(1).render(speed1, this);
	var center = speed1.getScales(1).getTrends(0).calcCenterPosition(); //marks' center (position)
	var outer = speed1.getScales(1).getTrends(0).calcOuterRadius();//Marks' radius in the scale
	var calcsize = speed1.getScales(1).getTrends(0).calcSize();//size of marks in the scale
	var str = "GaugeTrendPoint.calcCenterPosition() - X:" + center.getX() + " Y:" + center.getY() + "\n";
	str += "GaugeTrendPoint.calcOuterRadius() - X:" + outer.getX() + " Y:" + outer.getY() + "\n";
	str += "GaugeTrendPoint.calcSize() - " + calcsize;
	alert(str);
}
</script>
Clicking the GaugeTrendPoint button places a mark at a speedometer scale. This mark looks as follows:

The values of speedometer parameters returned by the calcCenterPosition, calcOuterRadius methods are also displayed:
GaugeTrendPoint.calcCenterPosition() - X:100 Y:180
GaugeTrendPoint.calcOuterRadius() - X:150 Y:150
See also: