To execute the example, create an HTML page and execute the following operations:
1. Add links to the following files: PP.css, PP.Express.css.
Also add links to the following JS files: PP.js, PP.Metabase.js, PP.Express.js, and resources.ru.js.
2. Then in the <head> tag add a script that creates dimension selection wizard, express report table and chart:
        var dimBarMaster, eaxGrid, metabase, eaxAnalyzer, eaxMbService, eaxChart;
        function Ready() {
            //Set resources folder
            PP.resourceManager.setRootResourcesFolder("../resources/");
            // Determine language settings for resources
            PP.setCurrentCulture(PP.Cultures.ru);
            // Create repository connection
            metabase = new PP.Mb.Metabase({
                ExportUrl: "PPService.axd?action=export",
                ImportUrl: "PPService.axd?action=import",
                PPServiceUrl: "PPService.axd?action=proxy",
                Id: "prognozplatform7",
                UserCreds: {
                    UserName: "user",
                    Password: "password"
                }
            });
            // Open repository connection
            metabase.open();
            // Create a service for working with express reports
            eaxMbService = new PP.Exp.EaxMdService({
                Metabase: metabase
            });
            // Open express report with the 109 key
            eaxAnalyzer = eaxMbService.editDocument(109);
            // Create a wizard containing EaxDimBarMasterPanel panels,
            // table and chart for displaying data
            dimBarMaster = new PP.Exp.Ui.EaxDimBarMaster({
                ParentNode: "dimBar",
                Width: 300,
                Height: 500,
                Source: eaxAnalyzer, // Determine data source
                ImagePath: "../build/img/", // Path to icons folder
                Service: eaxMbService,
                MetadataChanged: function (sender, args) {
                    console.log(dimBarMaster.getMode());
                }
            });
            eaxGrid = new PP.Exp.Ui.EaxGrid({
                Source: eaxAnalyzer,
                ParentNode: "divTable",
                EditMode: false,
                ImagePath: "../build/img/", // Path to icons folder
                Width: 300,
                Height: 500,
                Service: eaxMbService,
                AutoSendSelection: true
            });
            eaxChart = new PP.Exp.Ui.ChartBox({
                Source: eaxAnalyzer,
                ParentNode: "divChart",
                ImagePath: "../build/img/", // Path to icons folder
                Width: 500,
                Height: 400,
                Service: eaxMbService
            });
            dimBarMaster.setDataView([eaxGrid, eaxChart]);
        }
3. In the <body> tag as the value of the onLoad attribute specify name of the function used to create express report working area, and add blocks with the identifiers dimBar and divTable:
  <body onselectstart="return false" onload="Ready()">
      <table>
          <tbody>
              <tr>
                  <td style='vertical-align: top'>
                      <div id="dimBar">
                      </div>
                  </td>
                  <td>
                      <div id="divTable">
                      </div>
                  </td>
                  <td>
                      <div id="divChart">
                      </div>
                  </td>
              </tr>
          </tbody>
      </table>
    </body>
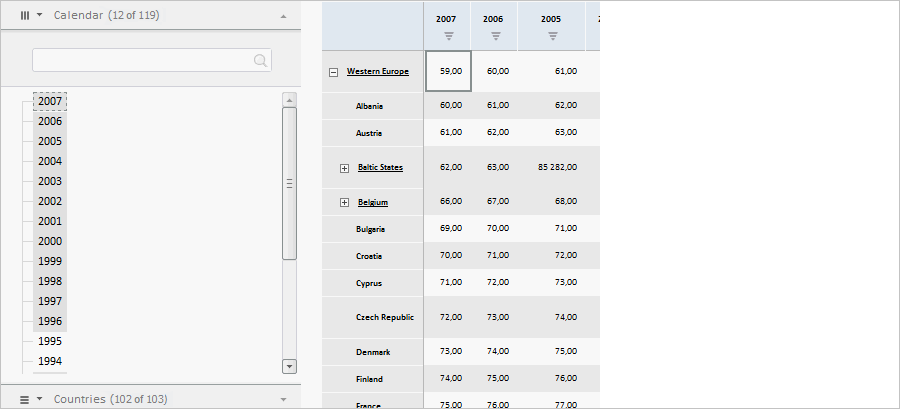
After executing the example the HTML page will contain the EaxDimBarMaster, EaxGrid and ChartBox components:
On refreshing report metadata, the browser console displays type of the first data view, which selection is set up in the wizard (Grid).
See also: