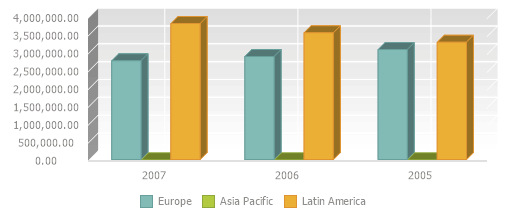
Executing the example requires that the HTML page contains the ExpressBox component named expressBox (see Example of Creating the ExpressBox Component) and have a chart loaded in the express report working area. Enable 3D view for the chart:
var chartView = expressBox.getDataView().getChartView();
var options;
// Get chart settings
if (chartView.getInstance() && chartView.getInstance().options) {
    options = chartView.getInstance().options;
} else {
    options = chartView.getOptions();
}
// Enable 3D view
options.chart.displayVolume3D = true;
chartView.setInstance(options);
After executing the example 3D chart view is enabled:

See also: