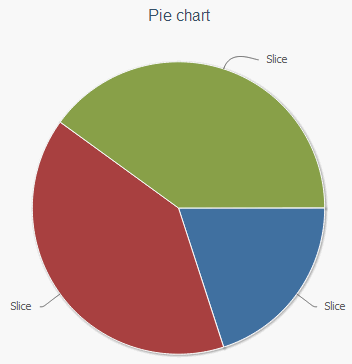
To create a pie chart:
In the head tag add links to the following libraries: PP.js, jquery.js and highcharts.src.js:
<head>
<script type="text/javascript" src="../../build/PP.js"></script>
<script type="text/javascript" src="../../libs/jquery.js"></script>
<script type="text/javascript" src="../../libs/hc/highcharts.src.js"></script>
</head>
In the Script tag add the Java Script code to initialize chart:
<script type="text/javascript">
    $(function () {
        highChart = new Highcharts.Chart({
            chart: {
                renderTo: 'container',
                defaultSeriesType: 'pie', // Pie chart
            },
            title: {
                text: 'Pie chart'
            },
            // Define two data series
            series: [{
                name: 'A',
                data: [1],
                startAngle: 90//sector rotation angle
            }, {
                name: 'B',
                data: [2]
            },
            {
                name: 'C',
                data: [2]
            }]
        });
    });
</script>
After executing the example a pie chart is added to the page. The first sector (blue one) in this chart is rendered with 90-degree angle:

See also: