PP.Ui.ChartSymbol(settings);
settings. JSON object that contains values of class properties.
The ChartSymbol constructor creates an instance of the ChartSymbol class.
To execute this example, the HTML page must contain the BubbleChart component named bubbleChart (see Example of Creating the BubbleChart Component). Create a new symbol, draw it, get and show data concerning symbol radius and position:
// Create a new bubble chart symbol
var symbol = new PP.Ui.ChartSymbol({
    X: 150,
    Y: 200,
    R: 30,
    Color: "#A9D8B5",
    Opacity: 1,
    Thickness: 4,
    MarkerShape: PP.Ui.IntervalsLegendMarkerShape.Circle,
    Chart: bubbleChart
});
// Draw bubble chart symbol
symbol.draw();
symbol.renderFrame(bubbleChart.getChartArea().getPaper());
// Get information about symbol size and position
var path = symbol.getPath().getPrimitives()[0];
console.log("Symbol center coordinates: (" + path.cx + "," + path.cy + "); Symbol radius: " + symbol.getR());
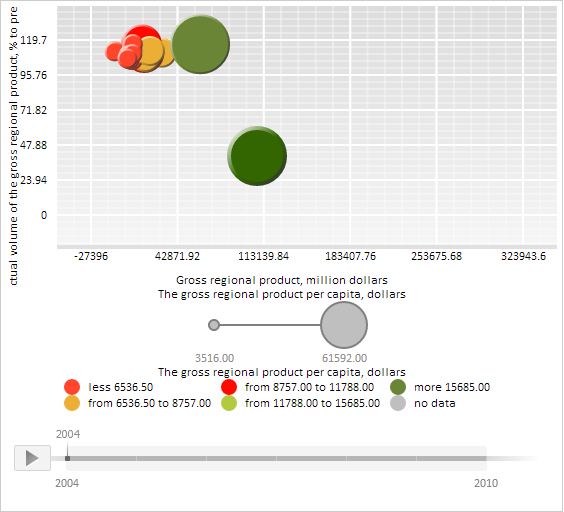
As the result of the example execution a new symbol is created and drawn:

The browser console shows information concerning symbol radius and position:
Coordinates of symbol center: (200,150); Symbol radius: 30
See also: