PP.Ui.ChartMarker(settings);
settings. JSON object that contains values of class properties.
The ChartMarker constructor creates an instance of the ChartMarker class.
To execute this example, the HTML page must contain the BubbleChart component named bubbleChart (see Example of Creating the BubbleChart Component). Set labels for X and Y axes of the bubble chart:
// Get bubble chart area
var chartArea = bubbleChart.getChartArea();
// Determine label parameters
var settings = {
    Length: 15, // Label length
    Chart: bubbleChart,
    Stroke: PP.Color.Colors.black, // Black label color
    Thickness: 2 // Label width in pixels
};
// get vertical axis level lines for the X axis
var xItems = chartArea.getGrid().getVerticals()._Items;
for (var i in xItems) {
    // Create a new axis label
    var marker = new PP.Ui.ChartMarker(settings);
    // Set a new value for axis label
    var value = xItems[i].getValue();
    marker.setValue(value);
    // Render label
    var secondCoord = bubbleChart.getChartArea().getPaperArea();
    marker.draw(bubbleChart.getChartArea()._GridLayer, PP.Ui.VisualType.X, secondCoord);
};
// Get horizontal level lines for the Y axis
var yItems = chartArea.getGrid().getHorizontals()._Items;
for (var i in yItems) {
    // Create a new axis label
    var marker = new PP.Ui.ChartMarker(settings);
    // Set a new value for axis label
    var value = yItems[i].getValue();
    marker.setValue(value);
    // Render label
    marker.draw(bubbleChart.getChartArea()._GridLayer, PP.Ui.VisualType.Y, 0)
};
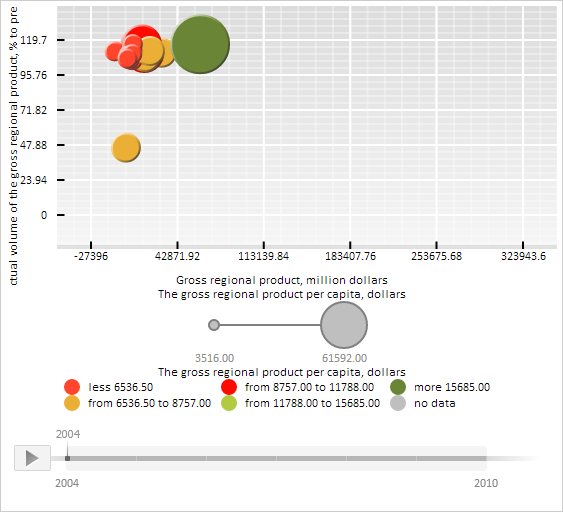
After executing the example black labels are set for X and Y axes of the bubble chart, labels are 15 pixels long and 2 pixels wide:
See also: