Below is the example of changing color formatting for all chart series. To do this, use features that allow for saving and loading a style to a file.
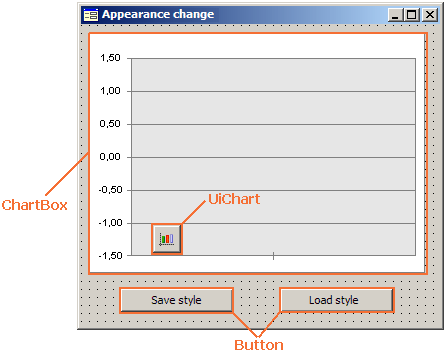
Create a form and place the components on this form: UiChart, ChartBox, and two Button components.

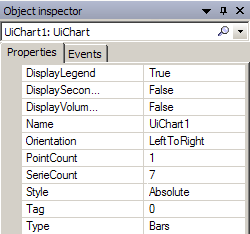
Then use the object inspector to specify for UiChart:
PoinCount = 1
SerieCount = 7

Then describe the OnGetDataValue event that is used to plot a graph. To do this, go to the Events tab and double-click OnGetDataValue. Write the code for the created event:
Sub UiChart1OnGetDataValue(Sender: Object; Args: IUiChartGetDataValueEventArgs);
Begin
Args.Result := True;
Args.Value := Args.PointIndex + Args.SerieIndex + 1;
End Sub UiChart1OnGetDataValue;
Set the OnClick event for the Button (Save Style) component:
Sub Button1OnClick(Sender: Object; Args: IMouseEventArgs);
Var
doc: IXmlDomDocument;
element: IXmlDomElement;
str : string = "<?xml version=""1.0"" encoding=""utf-8""?>" + #13 + #10 + "<test/>";
Begin
doc := New DOMDocument40.Create;
doc.loadXML( str );
element := doc.documentElement;
UiChart1.Chart.SaveDecoration(element);
doc.save("c:\Temp\xml\Decor.xml");
End Sub Button1OnClick;
Set the the OnClick event for the Button (Load Style) component:
Sub Button2OnClick(Sender: Object; Args: IMouseEventArgs);
Var
doc: IXmlDomDocument;
element: IXmlDomElement;
i: Integer;
Begin
i:= UIChart1.SerieCount;
UIChart1.SerieCount := 0; // before loading formatting style, chart must contain no data (0 series)
UIChart1.Chart.Series.FixedCount := 0; // the number of series, for which formatting is saved
UiChart1.Chart.ResetDataCache;
doc := New DOMDocument40.Create;
doc.load("c:\Temp\xml\Decor1.xml");
element := doc.documentElement;
UiChart1.Chart.LoadDecoration(element);
UiChart1.Chart.Refresh;
UIChart1.SerieCount := i; //return original number of series
End Sub Button2OnClick;
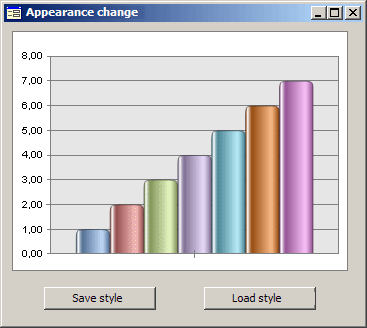
After starting the program, the form looks as follows:

Then, save a style to file. To do this, click the Save Style button. In the output file located at c:\Temp\xml\Decor1.xml, in the DefaultSerieDecoration node, change values for ColorHuge0 – ColorHuge8.
The values saved to file:
<DefaultSerieDecoration>
<SeriePaletteCount type="fixed value">8</SeriePaletteCount>
<ColorHuge0>0.592000</ColorHuge0>
<ColorHuge1>1.000000</ColorHuge1>
<ColorHuge2>0.219000</ColorHuge2>
<ColorHuge3>0.737000</ColorHuge3>
<ColorHuge4>0.533000</ColorHuge4>
<ColorHuge5>0.075000</ColorHuge5>
<ColorHuge6>0.836000</ColorHuge6>
<ColorHuge7>0.152000</ColorHuge7>
New values:
<DefaultSerieDecoration>
<SeriePaletteCount type="fixed value">8</SeriePaletteCount>
<ColorHuge0>0.9</ColorHuge0>
<ColorHuge1>0.8</ColorHuge1>
<ColorHuge2>0.7</ColorHuge2>
<ColorHuge3>0.6</ColorHuge3>
<ColorHuge4>0.5</ColorHuge4>
<ColorHuge5>0.4</ColorHuge5>
<ColorHuge6>0.3</ColorHuge6>
<ColorHuge7>0.2</ColorHuge7>
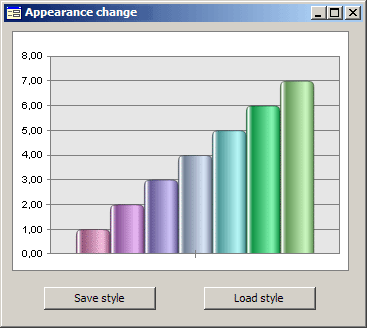
After specifying new values, save the file. Then, go back to the form and click the Load Style button that changes the fill for all chart series:

See also: