SeriesAsRings: Boolean;
SeriesAsRings: boolean;
The SeriesAsRings property determines whether series are displayed in the chart rings.
Available values:
True. Chart series are displayed in rings.
False. Chart series are displayed in sectors.
The property is not relevant for the doughnut chart (IChart.Type = ChartType.HoleSize).
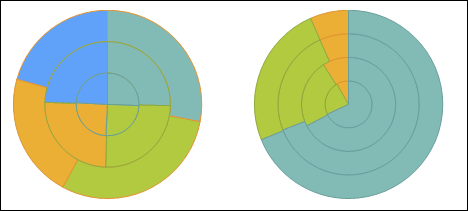
The following figure shows examples of displaying a chart with series in rings (left) and sectors (right):

To execute the example, place a button, the ChartBox and UiChart components on the form. Add event handlers, which are used in the example.
Add links to the Chart and MathFin system assemblies.
Sub UiChart1OnGetDataValue(Sender: Object; Args: IUiChartGetDataValueEventArgs);
Begin
Args.Result := True;
Args.Value := Math.Rand;
ChartBox1.Source := UiChart1 As IChartSource;
UiChart1.Type := ChartType.Circles;
End Sub UiChart1OnGetDataValue;
…
Sub Button1OnClick(Sender: Object; Args: IMouseEventArgs);
Begin
UiChart1.Chart.CircleInfo.SeriesAsRings := True;
End Sub Button1OnClick;
On executing the example a pie chart with series in sectors is displayed. After clicking the button series are displayed in rings.
To execute the example, place a button, the ChartBoxNet and UiChartNet components on the form. Specify a data source for ChartBoxNet. Add event handlers, which are used in the example.
Add links to the Chart and MathFin system assemblies.
Imports Prognoz.Platform.Interop.Chart;
Imports Prognoz.Platform.Interop.Forms;
Imports Prognoz.Platform.Interop.MathFin;
…
Private Sub uiChartNet1_OnGetDataValue(Sender: System.Object; Args: Prognoz.Platform.Interop.Chart.UiChartGetDataValueEventArgs);
Var
Math: MathClass = New MathClass();
Begin
Args.Result := True;
Args.Value := Math.Rand();
chartBoxNet1.Source := uiChartNet1 As IChartSource;
uiChartNet1.Type := ChartType.chtCircles;
End Sub;
…
Private Sub button1_Click(sender: System.Object; e: System.EventArgs);
Begin
uiChartNet1.ChartUi.Chart.CircleInfo.SeriesAsRings := True;
End Sub;
See also: