DrawUnderSeries: Boolean;
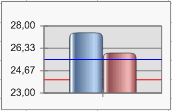
The DrawUnderSeries property determines a level line position. If this property is set to True, the level line is displayed under data series; if this property is set to False, the level line is displayed above data series.
The property is set to False by default.
This unit is connected to the regular report, which sheet contains a chart. The chart must contain level lines.
Sub Custom;
Var
Chart: IChart;
Begin
Chart := PrxReport.ActiveReport.ActiveSheet.Table.Objects.Item(0).Extension As IChart;
Chart.AxisY.LevelLines.Item(0).DrawUnderSeries := True;
PrxReport.ActiveReport.ActiveSheet.Recalc;
End Sub Custom;
After executing the example the level line on the chart is displayed under data series.
See below examples of a level displayed above data series (top) and a level displayed under data series (bottom):

See also: