DisplayMode: ChartDisplayMode;
DisplayMode: Prognoz.Platform.Interop.Chart.ChartDisplayMode;
The DisplayMode property determines a chart display mode.
Only some of display modes are available for each chart type.
Executing the example requires a form containing the components:
ChartBox with the ChartBox1 identifier.
UiChart with the UiChart1 identifier that is a data source for ChartBox1.
Sub Form_FormOnShow(Sender: Object; Args: IEventArgs);
Var
c: IChart;
Begin
UiChart1.PointCount := 5;
UiChart1.SerieCount := 15;
UiChart1.Style := ChartStyle.Mixed;
UiChart1.DisplayMode := ChartDisplayMode.ModeManhattan3D;
UiChart1.DisplayVolume3D := True;
c := UiChart1.Chart;
c.DisplayMode := ChartDisplayMode.ModeManhattan3D;
c.DisplayZAxis := True;
c.AxisZ.Selected := True;
End Sub Form_FormOnShow;
{ OnGetDataValue }
Sub UiChart1OnGetDataValue(Sender: Object; Args: IUiChartGetDataValueEventArgs);
Begin
Args.Result := True;
Args.Value := Args.PointIndex + Args.SerieIndex + 5;
End Sub UiChart1OnGetDataValue;
{ OnGetGroupCount }
Sub UiChart1OnGetGroupCount(Sender: Object; Args: IUiChartGroupCountEventArgs);
Begin
Args.Result := 5;
Debug.WriteLine("OnGetGroupCount: " + Args.Result.ToString);
End Sub UiChart1OnGetGroupCount;
{ OnGetGroupName }
Sub UiChart1OnGetGroupName(Sender: Object; Args: IUiChartGroupNameEventArgs);
Begin
Args.Result := "GroupName " + Args.GroupIndex.ToString;
Debug.WriteLine("OnGetGroupName: " + Args.GroupIndex.ToString);
End Sub UiChart1OnGetGroupName;
{ OnGetParentSerieIndex }
Sub UiChart1OnGetParentSerieIndex(Sender: Object; Args: IUiChartParentSerieIndexEventArgs);
Begin
If Args.SerieIndex < 5 Then
Args.Result := -1;
End If;
Select Case Args.SerieIndex
Case 3, 6, 9, 12: Args.Result := 0;
Case 4, 7, 10, 13: Args.Result := 1;
Case 5, 8, 11, 14: Args.Result := 2;
End Select;
End Sub UiChart1OnGetParentSerieIndex;
{ OnGetSerieGroupIndex }
Sub UiChart1OnGetSerieGroupIndex(Sender: Object; Args: IUiChartSerieGroupIndexEventArgs);
Begin
Select Case Args.SerieIndex //5 groups
Case 0, 1, 2: Args.Result := 0;
Case 3, 4, 5: Args.Result := 1;
Case 6, 7, 8: Args.Result := 2;
Case 9, 10, 11: Args.Result := 3;
Case 12, 13, 14: Args.Result := 4;
End Select;
End Sub UiChart1OnGetSerieGroupIndex;
{ OnGetSerieGroupName }
Sub UiChart1OnGetSerieGroupName(Sender: Object; Args: IUiChartSerieGroupNameEventArgs);
Begin
Args.Result := "SerieGroupName " + Args.SerieIndex.ToString;
Debug.WriteLine("OnGetSerieGroupName: " + Args.SerieIndex.ToString);
End Sub UiChart1OnGetSerieGroupName;
{ OnGetSerieName }
Sub UiChart1OnGetSerieName(Sender: Object; Args: IUiChartSerieNameEventArgs);
Begin
Args.Result := "Serie " + Args.SerieIndex.ToString;
Debug.WriteLine("OnGetSerieName: " + Args.SerieIndex.ToString);
End Sub UiChart1OnGetSerieName;
{ OnGetPointName }
Sub UiChart1OnGetPointName(Sender: Object; Args: IUiChartPointNameEventArgs);
Begin
Args.Result := "Point " + Args.PointIndex.ToString;
Debug.WriteLine("OnGetPointName: " + Args.PointIndex.ToString);
End Sub UiChart1OnGetPointName;
{ OnGetRelativeSerieEnabled }
Sub UiChart1OnGetRelativeSerieEnabled(Sender: Object; Args: IUiChartRelativeSerieEnabledEventArgs);
Begin
Args.Result := True;
End Sub UiChart1OnGetRelativeSerieEnabled;
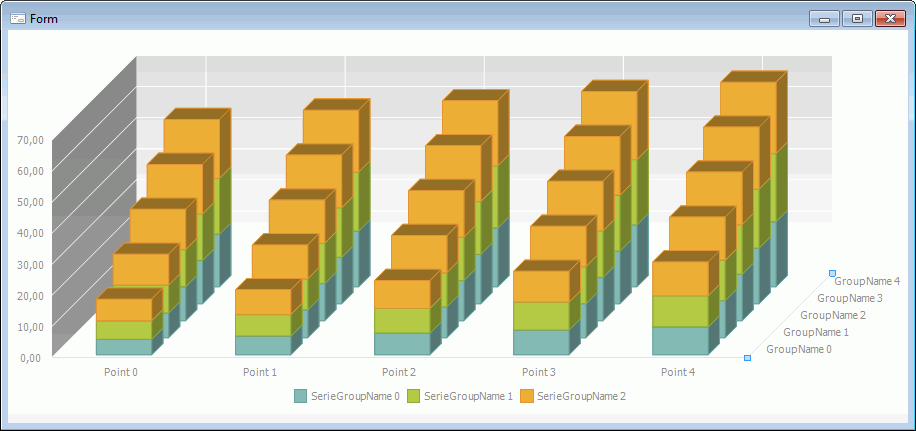
After opening the form a 3D histogram with selected Z axis is rendered in the ChartBox component:

The console window displays parameters of occurring events.
The requirements and result of the Fore.NET example execution match with those of the Fore example. Use Fore.NET analogs instead of Fore components.
Imports Prognoz.Platform.Interop.Chart;
…
Private Sub Form_Shown(sender: System.Object; e: System.EventArgs);
Var
c: IChart;
Begin
UiChartNet1.PointCount := 5;
UiChartNet1.SerieCount := 15;
UiChartNet1.Style := ChartStyle.chsMixed;
UiChartNet1.DisplayMode := ChartDisplayMode.cdModeManhattan3D;
UiChartNet1.DisplayVolume3D := True;
c := UiChartNet1.ChartUi.Chart;
c.DisplayMode := ChartDisplayMode.cdModeManhattan3D;
c.DisplayZAxis := True;
c.AxisZ.Selected := True;
End Sub;
{ OnGetDataValue }
Private Sub uiChartNet1_OnGetDataValue(Sender: System.Object; Args: Prognoz.Platform.Interop.Chart.UiChartGetDataValueEventArgs);
Begin
Args.Result := True;
Args.Value := Args.PointIndex + Args.SerieIndex + 5;
End Sub;
{ OnGetGroupCount }
Private Sub uiChartNet1_OnGetGroupCount(Sender: System.Object; Args: Prognoz.Platform.Interop.Chart.UiChartGroupCountEventArgs);
Begin
Args.Result := 5;
System.Diagnostics.Debug.WriteLine("OnGetGroupCount: " + Args.Result.ToString());
End Sub;
{ OnGetGroupName }
Private Sub uiChartNet1_OnGetGroupName(Sender: System.Object; Args: Prognoz.Platform.Interop.Chart.UiChartGroupNameEventArgs);
Begin
Args.Result := "GroupName " + Args.GroupIndex.ToString();
System.Diagnostics.Debug.WriteLine("OnGetGroupName: " + Args.GroupIndex.ToString());
End Sub;
{ OnGetParentSerieIndex }
Private Sub uiChartNet1_OnGetParentSerieIndex(Sender: System.Object; Args: Prognoz.Platform.Interop.Chart.UiChartParentSerieIndexEventArgs);
Begin
If Args.SerieIndex < 5 Then
Args.Result := -1;
End If;
Select Case Args.SerieIndex
Case 3, 6, 9, 12: Args.Result := 0;
Case 4, 7, 10, 13: Args.Result := 1;
Case 5, 8, 11, 14: Args.Result := 2;
End Select;
End Sub;
{ OnGetSerieGroupIndex }
Private Sub uiChartNet1_OnGetSerieGroupIndex(Sender: System.Object; Args: Prognoz.Platform.Interop.Chart.UiChartSerieGroupIndexEventArgs);
Begin
Select Case Args.SerieIndex //5 groups
Case 0, 1, 2: Args.Result := 0;
Case 3, 4, 5: Args.Result := 1;
Case 6, 7, 8: Args.Result := 2;
Case 9, 10, 11: Args.Result := 3;
Case 12, 13, 14: Args.Result := 4;
End Select;
End Sub;
{ OnGetSerieGroupName }
Private Sub uiChartNet1_OnGetSerieGroupName(Sender: System.Object; Args: Prognoz.Platform.Interop.Chart.UiChartSerieGroupNameEventArgs);
Begin
Args.Result := "SerieGroupName " + Args.SerieIndex.ToString();
System.Diagnostics.Debug.WriteLine("OnGetSerieGroupName: " + Args.SerieIndex.ToString());
End Sub;
{ OnGetSerieName }
Private Sub uiChartNet1_OnGetSerieName(Sender: System.Object; Args: Prognoz.Platform.Interop.Chart.UiChartSerieNameEventArgs);
Begin
Args.Result := "Serie " + Args.SerieIndex.ToString();
System.Diagnostics.Debug.WriteLine("OnGetSerieName: " + Args.SerieIndex.ToString());
End Sub;
{ OnGetPointName }
Private Sub uiChartNet1_OnGetPointName(Sender: System.Object; Args: Prognoz.Platform.Interop.Chart.UiChartPointNameEventArgs);
Begin
Args.Result := "Point " + Args.PointIndex.ToString();
System.Diagnostics.Debug.WriteLine("OnGetPointName: " + Args.PointIndex.ToString());
End Sub;
{ OnGetRelativeSerieEnabled }
Private Sub uiChartNet1_OnGetRelativeSerieEnabled(Sender: System.Object; Args: Prognoz.Platform.Interop.Chart.UiChartRelativeSerieEnabledEventArgs);
Begin
Args.Result := True;
End Sub;
See also: