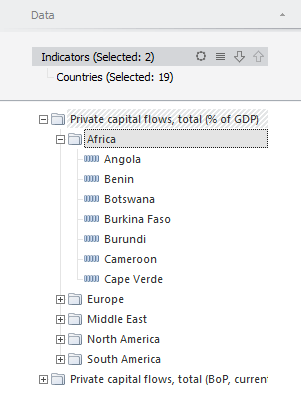
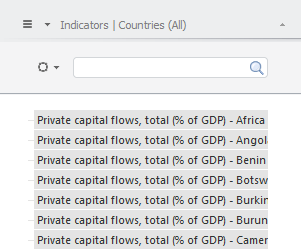
Combination of dimensions merges several dimensions into one and displays its elements as a time series tree.
Combined dimension displays elements as a time series tree similar to the Time Series Analysis tool, and reduces data source size. Name of combined dimension elements consists of names of elements of source dimensions separated with a dash.
NOTE. Combination of dimensions is available in the Dashboards and the Analytical Queries (OLAP) tools.
The following components may be used as a source, from which dimensions may be used to form a composite dimension:
Time series database.
Virtual cube.
Standard cube.
Calendar and scenario dictionaries cannot be used in a combined dimension.
Each sheet of express report or each dashboard block can contain only one combined dimension.
When combined dimensions are used, data validation is not available. On creating a combined dimension a previously configured validation will be disabled.
On creating a combined dimension calculated elements contained in dimensions will be deleted.
On creating a combined dimension, the Map visualizer will be deactivated, if combined dimension includes the observation objects dimension or a dimension containing territory binding attributes.
To create a combined dimension, click the ![]() Combine button on the Hierarchy ribbon tab and select in the drop-down menu:
Combine button on the Hierarchy ribbon tab and select in the drop-down menu:
Data source dimensions required for combination.
The Time Series Mode item for combination of all available data source dimensions.
NOTE. The Hierarchy tab is available if the Selection tab is selected on the side panel.
As a result, the selected dimensions are combined into one. On creating a combined dimension, selection is formed from selection of source dimensions.
Tabs on the Selection group of tabs of the side panel are available to work with a combined dimension:
The tab with a list of elements.
The Data tab containing a series tree.
Name of the tab with a list of elements is formed from names of source dimensions separated with a vertical line. For example: Territories | Indicators, where Territories and Indicators are names of source dimensions.
To undo combination of dimensions, select a tab with the list of combined dimension elements in the Selection group of tabs on the side panel and execute one of the following operations:
Select the ![]() Alternative Hierarchy > Reset item in the dimension's context menu.
Alternative Hierarchy > Reset item in the dimension's context menu.
Select the Alternative Hierarchy > Reset item on the Hierarchy ribbon tab.
Deselect all dimensions in the drop-down menu of the ![]() Combine button on the Hierarchy ribbon tab.
Combine button on the Hierarchy ribbon tab.

The Data tab presents elements of a combined dimension as a time series tree.
Time series can be added to a visualizer selection in the following way:
Double-click a series or folder with series.
Drag the required series into the workspace.
Tree structure and name of a series are formed based on a calculation chain in the upper part of the panel.
On creating a combined dimension the calculation chain is formed from the current selection of dimensions in use.
Calculation chain and series tree can be set up using the buttons next to dimensions names:

 Move down/up. Dimensions hierarchy setup in a series tree.
 Settings menu. Deleting of dimension from the chain or setting up filtering and sorting.
 Element list. Selection of elements, which are used in forming tree structure. Standard commands for working with dimensions selection are available in the context menu.

The list of combined dimension elements contains time series formed by the calculation chain on the Data tab. The most of standard functions for working with selection are available, except for using selection groups, alternative hierarchy and selection schemas.
See also: