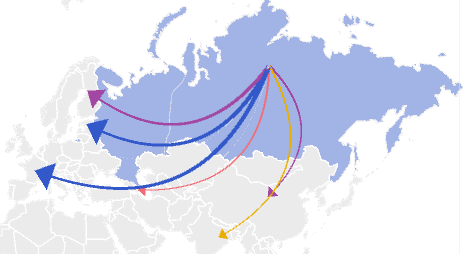
Arrow is a map object linked to two territories: the one where the arrows starts and the one where the arrow is directed. Arrows enable the user to visualize the direction of flows between territories, for example, export or import of goods.
On hovering the mouse over the arrow the tooltip containing names of provider territory, consumer territory, arrow and metric values, which are visualized by the arrow, is displayed.
To show arrows all requirements given in the Requirements for Showing Arrows section must be met.
NOTE. Showing of arrows is not available in the Time Series Analysis tool.
Example of arrows on the map:

To set up:
General parameters and arrow fill, use the Arrow side panel tab.
Arrow labels, use the Arrow Labels side panel tab. All settings of arrow labels are the same as map tooltip settings.
Arrow fill legend, use the Arrow Color Legend side panel tab.
Arrow size legend, use the Arrow Size Legend side panel tab. Settings are available if the element determining the Arrow Width parameter is specified in the metrics dimension.
See also: