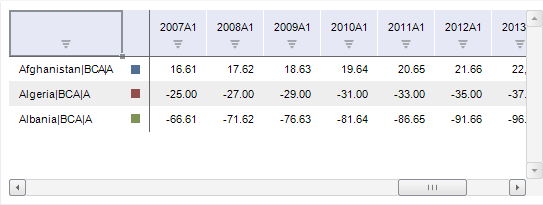
A data table is used to display and work with time series data. Each series has its name, color in a chart and data:

When a table is rotated, table rows and columns are swapped.
To rotate a table, click the ![]() Rotate Table button on the Table ribbon tab. Column and row titles are swapped, data table is rebuilt. Table element selection is also rotated.
Rotate Table button on the Table ribbon tab. Column and row titles are swapped, data table is rebuilt. Table element selection is also rotated.
Data sorting parameters are reset when table is rotated.
To filter empty values of series displayed in the table, use:
The Hide Values checkbox on the View tab of the Data tab group on the side panel.
The ![]() Filter button in the Data group on the Home or Data ribbon tab.
Filter button in the Data group on the Home or Data ribbon tab.
To sort data, use buttons in column headers. When clicked, the button changes the view according to the selected sorting mode:
![]() . Values are not sorted.
. Values are not sorted.
![]() . Descending sorting of values.
. Descending sorting of values.
![]() . Ascending sorting of values.
. Ascending sorting of values.
Sorting features:
Sorting is unavailable if calendar elements are in the column, that is, the table was rotated.
In calculated series sorting of child series is not performed.
NOTE. The option is available only in the desktop application.
To find or replace table data:
Click the ![]() Find and Replace button on the Table ribbon tab.
Find and Replace button on the Table ribbon tab.
Click the table and press CTRL+F.
The Find and Replace dialog box opens.

 Change a period of displaying data
Use the Display Period group on the Home or View ribbon tab.
Start. Date, starting from which series values are displayed.
End. Date, to which the series values are displayed.
The period end date must be later than the period start date.
For visual clarity, use conditional formatting.
To apply and set up conditional formatting, see theConditional Formatting section.
To display sparklines, use the Lines button in the Sparklines tab on the Table ribbon tab.
To get a detailed description, see the Displaying Sparklines section.
When working with data the following advanced analytics features are available:
Econometrics.
Data validation.
Data mining.
To get a detailed description, see the Applying Advanced Analytics section.
To set up table formatting, use side panel tabs:
View. Set up common formatting parameters.
Data Area. Set up data formatting in the table.
Headers. Set up table heading formatting.
NOTE. The Data Area and the Headers tabs are available only in the desktop application.
The following styles can be used for table formatting in a workbook:
Table styles.
Table cell styles.
External styles tables.
For detailed description see the Setting Up Table Style section.

 Set up format of displayed values
To set up the format of values displayed in the table, use the Number group on the Table ribbon tab.
Available parameters are given in the table:
| Brief description | |
| Determines values format in cells. | |
| Specifies an alternative format of the monetary unit. The monetary unit type is determined in the drop-down menu of the button. | |
| Sets the percentage values format in the table. | |
| Sets the thousands separator when displaying values in cells. | |
| Decreases digit capacity. This is used to display less precise values. | |
| Increases digit capacity. This is used to display more precise values. |
NOTE. Value format setting is available in the desktop application on the Number Format tab in the Format dialog box. To display the dialog box, click the ![]() button in the lower right corner of the Number group on the Table ribbon tab.
button in the lower right corner of the Number group on the Table ribbon tab.
NOTE. Changing table zoom is available only in the desktop application. In the web application the whole workbook zoom can be changed using the browser.
To change zoom:
Click the ![]() Zoom button on the Table ribbon tab. In the menu that opens select the required zoom. Available values:
Zoom button on the Table ribbon tab. In the menu that opens select the required zoom. Available values:
200%. 150%. 100%. 75%. 50%. 25%. Fixed zoom values.
Custom. Custom zoom. The Zoom dialog box opens to enter the zoom value.
Hover the pointer over the table, hold down the CTRL key and scroll up to zoom in or scroll down to zoom out.
Table zoom is changed. The zoom of other workbook elements remains unchanged.
To display the calendar in the reverse order, from later dates to earlier ones, click the ![]() Reverse Calendar button on the View ribbon tab.
Reverse Calendar button on the View ribbon tab.
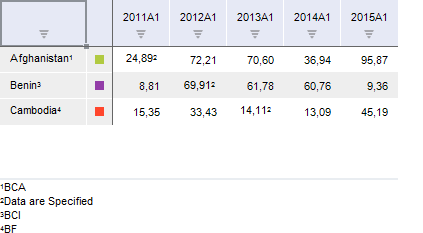
Using the Fore language enables the user to display and set up footnotes for series and observations in the table.
Numeric, text or symbol footnotes can be used. Custom formulas, values of one or several observation or series attributes can be used as a footnote value. A detailing positioned at the right, left, top or bottom of the data table, can be shown for footnotes.
NOTE. Footnotes can be exported only to the following formats: PDF, EMF, RTF, XLS, XLSX. For details about footnotes export see the Workbook Export section.
See below an example of data table with footnotes:

See also:
Working with Time Series | Working with Calculated Series | Data Validation