Drill down and drill up are available in the Analytical Queries (OLAP), Dashboards and Reports tools.
Data drill down is the operation, which enables the user to move through data levels: from totals to detailed ones. Available drill down granularity is determined by data source dimension hierarchy.
Drill up is the opposite operation to drill down allowing to move from detailed to total data.
NOTE. Drill down is not available for the chart series corresponding to calculated values.
To drill down data:
Select the Drill Down item in data series's context menu.
Double-click the series.
To drill up data:
Select the Drill Up item in the data series's context menu.
Double-click the series holding down the SHIFT key.
NOTE. In the Dashboards tool commands to drill down and drill up data are placed in the Chart group of data series's context menu.
If on drill down or drill up the level without data is displayed, it is required to change manually selection on the Selection side panel tab.
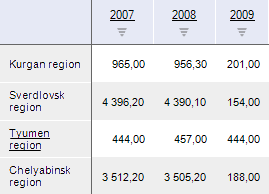
The figure shows a table consisting of four dimension elements. The Tyumen Region element has child elements. This element is displayed as a hyperlink:

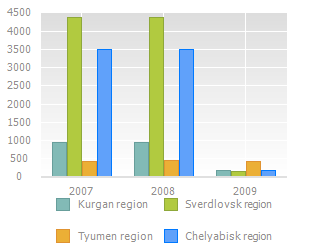
A chart was created based on this table:

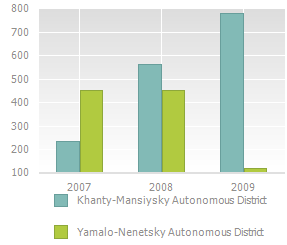
Select the Tyumen Region series and select the Drill Down context menu item. The user will be moved to the child level of the Tyumen Region element, the chart will be rebuilt as follows:

To drill up data, use the Drill Up item in the context menu of the series. The chart will return its original appearance.
See also: